The Take Five Report: 11/3/23
I
Markets:
I-I
Global Market Recap:
United States:
- S&P: +1.89%
- Dow: +1.70%
- Nasdaq: +1.78%
- Russell 2k: +2.67%
U.S. markets opened the session well into positive territory and didn’t stop there. Markets rallied on the back of an insanely positive Productivity report, Unit Labor Costs, and Factory Orders reports, causing bulls to have full control throughout the session and for indexes to finish up significantly.
Asia:
- Shanghai: +0.71%
- Hong Kong: +2.52%
- Japan: +1.10%
- India: +0.44%
Asian markets rose once again along with the rest of the global markets to close out the week. China’s service sector expanded at a slightly faster pace in October, with the index rising to 50.4 from 50.2 in the prior report. Hong Kong’s private sector activity contracted further in this report, as new business continues to fall.
Europe:
- UK: +1.42%
- Germany: +1.48%
- France: +1.85%
- Italy: +1.77%
European stocks surged in yesterday’s session, with France and Spain pacing gains in the region. This followed greatly positive economic data out of the U.S., as well as the BOE and Fed ultimately deciding to pause rates once again and hold the line (queue Toto).
I-II
U.S. Sectors Snapshot:
- Communication Services: +1.32%
- Consumer Discretionary: +2.61%
- Consumer Staples: +1.30%
- Energy: +3.02%
- Financials: +2.36%
- Health Care: +1.59%
- Industrials: +2.06%
- Info Tech: +1.69%
- Materials: +1.93%
- Real Estate: +3.10%
- Utilities: +1.87%
II
Technicals:
II-I
Volatility Index: (VIX)
Thursday Recap:
The VIX opened yesterday’s session lower at $16.59, and only reached a high of $16.62. Prices declined throughout the day and reached a low of $15.58 before closing at $15.66.
Daily Chart:
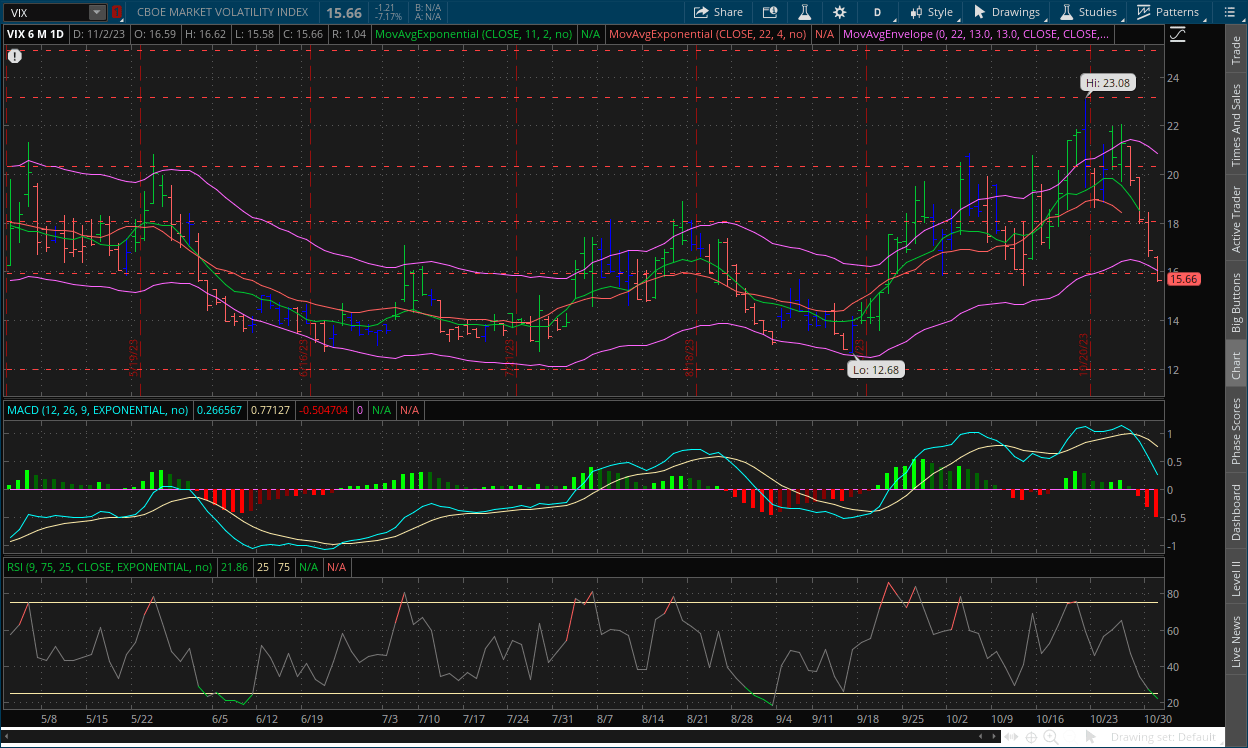
Strength once again moved dramatically in favor of the VIX bears, as the indicator has now reached a new multi month low. Inertia also continued to shift dramatically towards the downside as well.
Prices have collapsed since the activation of the bearish divergence, which we thought was the likely case. However we didn't expect it this quickly by any means. The new multi month low in strength usually means prices will continue in that direction, and coming off the heels of a bearish divergence, that will likely be the case for some time until the VIX reaches its next point of consolidation and given the rapidness of the decline, it'll likely be lower than expected, perhaps around the $12 major support level.
II-II
S&P 500: (SPX)
Thursday Recap:
The S&P opened yesterday’s session at $4,268 which would also be the low on the day. Prices soared to reach a high of $4,319 before closing at $4,317.
Daily Chart:
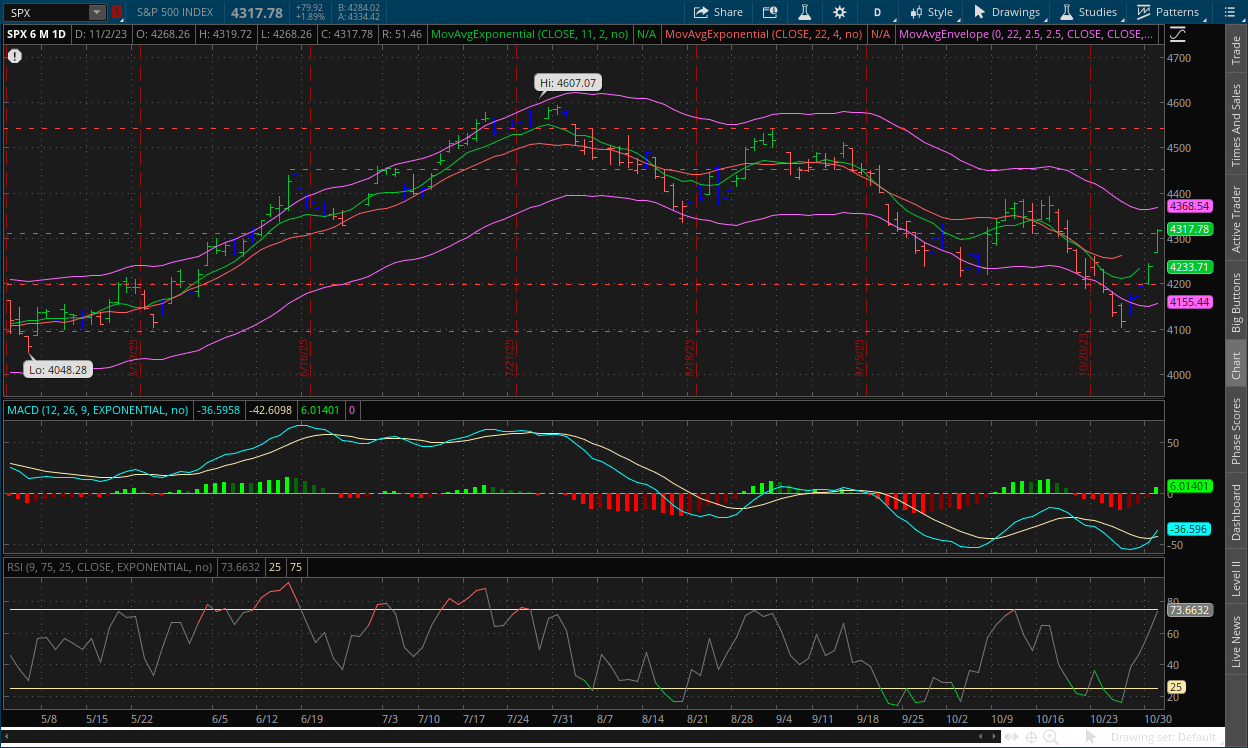
Strength moved in favor of the bulls once again as they’ve officially retaken the centerline and will begin a new cycle above that point. Inertia continued its shift towards the upside as it catches up to jumping prices.
Prices have skyrocketed since the activation process of the bullish divergence first began. This divergence isn’t the strongest, but it is still noticeable, and the continued weakness by the bears during this trend has been reflected in the MACD-H with each new price low which is something we picked up on during the second cycle of this trend. But as we've said, the weakness isn’t as evident as it was in the VIX. Given the recent batch of positive fundamental data, the new trend may last longer than originally expected, especially with a potential narrative shift from the Fed, as Powell may have hinted at rate-cuts in the last meeting.
III
Fundamentals:
III-I
Headlines:
1.) MarketWatch: Jobs-report reaction: ‘It is hard to imagine the Fed hiking interest rates any further,’ economist says
2.) MarketWatch: Ray Dalio likens U.S. restrictions on China tech exports to embargo before Pearl Harbor
3.) MarketWatch: Bank of America says emerging markets are showing signs of capitulation
4.) Wall Street Journal: Traders bet on more rate cuts after weak jobs report
5.) Wall Street Journal: Sam Bankman-Fried is convicted of fraud in FTX collapse
6.) Wall Street Journal: Apple sales decline as China market weighs on earnings report
7.) Bloomberg: China foreign investment gauge turns negative for first time
III-II
Q3 Productivity & Unit Labor Costs Report - Preliminary Reading:
Highlights:
|
Index: |
Q2: |
Q3: |
Wall Street Expectations: |
Take Five Expectations: |
|---|---|---|---|---|
|
Productivity: |
3.6%(r) |
4.7% |
3.5% |
4.0% |
|
Unit Labor Costs: |
3.2%(r) |
-0.8% |
1.5% |
1.2% |
Productivity:
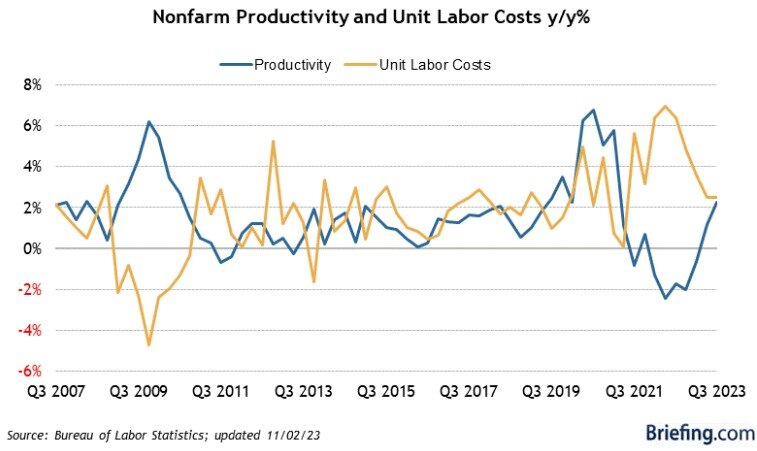
Labor productivity increased a staggering 4.7% in Q3, as this report came in much hotter than both our own and Wall Street’s expectations, and followed an upwardly revised 3.6% increase (from 3.5%) in Q2. This was the highest rate of productivity in 3 years.
Unit Labor Costs:
Labor costs declined -0.8% in Q3 which was once again well below our own and Wall Street’s expectations. This followed an upwardly revised 3.2% increase (from 2.2%) in Q2.
Quick Note:
We adjusted my own expectations for this report following Thursday’s GDP. Our original forecast was similar to other analysts, and after the GDP we expected this to beat the original expectations fairly easily, but to this extent was a surprise to be sure, but a welcomed one (only real ones will get that last line).
Finer Details:
Headline Calculation & Total Output:
Labor Productivity, or output per hour, is calculated by dividing real output by the hours worked by all workers. Increases in hourly wages increase unit labor costs, but increases in productivity tend to reduce them which is what we saw here.
Total output increased 5.9%, and hours worked increased 1.1%. Real hourly wages (which takes consumer prices into account), increased 0.3% in Q3, and 0.6% year over year.
Manufacturing:
The manufacturing sector’s productivity declined -0.7%, with output decreasing -0.1% while hours worked increased 0.7%, and productivity was down-0.7% year over year. Unit labor costs increased by 7.0% in Q3, reflecting a 6.2% increase in hourly wages, and was up 5.8% year over year.
Durable manufacturing (goods that don’t need to be purchased often, e.g. Tech, furniture, cars, etc.) saw productivity decrease by -1.4%, and reflected a 2.3% boost in output and a 3.8% increase in hours worked.
Nondurable manufacturing (goods that need to be purchased often, e.g. paper products, plastics, cleaning products, etc.) productivity is where the boost was, jumping 2.1%. But output decreased by -2.4% while hours worked slid -4.4%.
Putting It Together:
This was a very good report to see in this environment, and it showed a lot of promise similar to GDP. Productivity is increasing much faster than people expected, as the jump in Q2 reflected the same reaction to this report as well.
Productivity:
The labor market reports throughout this year have shown wide variations of numbers and revisions but all have shown increases in the number of jobs, with the trend being at around 180,000, some higher and some lower. The reason why this came as a shock is because you have more and more people joining the workforce through immigration (we won’t get political, strictly data driven for now) or through new hires. This has slowly been building back up the labor force participation rate to pre-pandemic levels (even though that had also been falling for over a decade but that’s a conversation for another time), and the rapid increase in productivity is what is shocking. The productivity increase is likely due to businesses being more demanding, cutting costs, and becoming more efficient in this type of environment.
Unit Labor Costs:
The decrease in unit labor costs also came as a surprise. The employment cost index was released on Wednesday and showed a 1.1% increase quarter over quarter. This is a little hot, as it reflects a 4.4% increase year over year which is above the Fed’s 3% target. But the good news was that it’s still trending down overall. However, unit labor costs coming in at -0.8% compared to what was expected is extremely good news and shows that concerns of a wage price spiral happening again, are likely blown out of proportion, which is something we’ve been saying for a while now. Granted, the measure of unit labor costs is volatile, but the drop does help smooth out the overall trend which is very important in our analysis of where the trend will be heading in the future.
IV
Market Psychology & Final Thoughts:
Psychology:
Market participants have quickly shifted from doom, gloom, and recession talks to everything’s great again in a matter of days. This type of flip flop always brings us back to Ben Graham and Warren Buffett’s Mr. Market. In short, they describe him as a bipolar mental patient that gets into these cycles of depression and euphoria that can (and will) change in what seems like an instant. Every week we continue to monitor the markets, that analogy resonates deeper and deeper. The point we're trying to make is don’t get caught up in the rapidly changing emotions of Mr. Market, as he tends to suck a lot of people in but remain separate and logical.
Final Thoughts:
U.S. markets opened the day hot but are coming back down to earth in the first hour. European markets are gaining as well but have also pulled back and the VIX has started to stall. Bond yields are continuing to plummet as well as crude. The drop in bond yields may be a discussion in Tuesday’s report, as Monday’s will be reserved for today’s labor market data. We hope you all found this helpful, learned about Mr. Market, and do something you haven’t done in a while this weekend.