The Take Five Report: 9/28/23
I
Markets:
I-I
Global Market Recap:
United States:
- S&P: +0.02%
- Dow: -0.20%
- Nasdaq: +0.22%
- Russell 2k: +0.98%
U.S. indexes opened yesterday’s session in the green, but would immediately begin to sell off and continue that trend until midday where a bottom was formed. Stocks would steadily rally from there, and markets would close with marginal gains minus the Dow. The Russell 2000 small cap index outperformed the market, as small cap stocks are growing prone to more sensitive swings as volatility increases.
Asia:
- Shanghai: +0.10%
- Hong Kong: -1.36%
- Japan: -1.54%
- India: -0.92%
Asian markets mostly fell in this morning’s session as a sharp rally in oil prices and treasury yields hurt sentiment. China’s real estate market, after showing a little signs of easing, took a blow again, as shares of China Evergrande were suspended in Hong Kong after the chairman had been placed under police watch.
Europe:
- UK: -0.43%
- Germany: -0.25%
- France: -0.03%
- Italy: -0.31%
European stocks as a collective would close at a six month low in yesterday’s session, as is seen in the pan-European Stoxx 600. Germany and France saw consumer sentiment and consumer confidence reports fall even further.
I-II
U.S. Sectors Snapshot:
- Communication Services: +0.54%
- Consumer Discretionary: -0.38%
- Consumer Staples: -0.77%
- Energy: +2.51%
- Financials: -0.20%
- Health Care: -0.49%
- Industrials: +0.76%
- Info Tech: +0.17%
- Materials: +0.02%
- Real Estate: -0.82%
- Utilities: -1.93%
II
Technicals:
II-I
Volatility Index: (VIX)
Wednesday Recap:
The VIX opened the day lower at $18.29 compared to Tuesday’s $18.94 close. Prices worked to a new high of $19.71, but would later fall all the way to a low of $18.03 before closing near the open at $18.22.
Daily Chart:
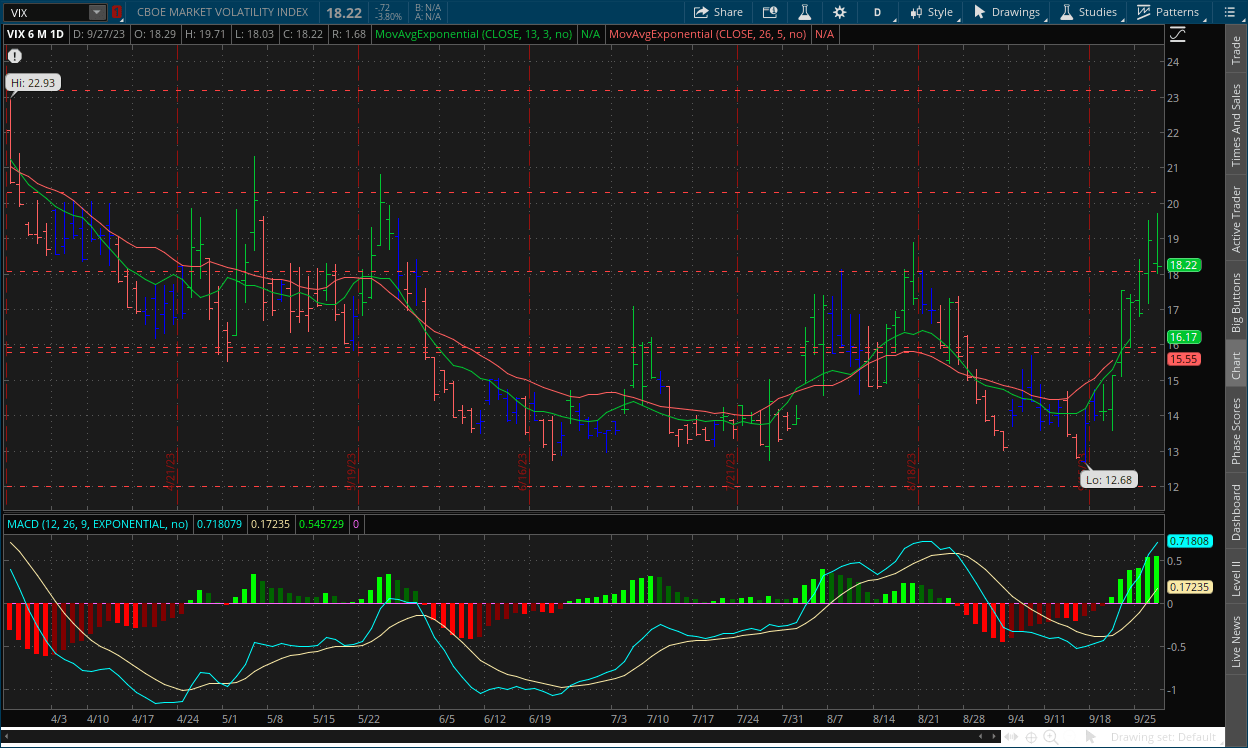
Strength moved in favor of the VIX bulls for the ninth straight session as the MACD-H continues to make new multi month highs during this cycle, albeit today’s push was tempered but again that’s to be expected. Inertia continued to shift towards higher implied volatility on the front end, but looking at it as a whole it still needs more to truly turn.
The VIX bulls managed to keep prices above the $18 support level in yesterday’s session, which was a key win for them. We may see a break below within the next day or two, but so long as the VIX bulls can keep prices elevated, they have a good chance at continuing this trend.
II-II
S&P 500: (SPX)
Wednesday Recap:
The S&P opened the day slightly higher at $4,282, and worked to a high of $4,292. Prices during the first half slide would reach a low of $4,238, its lowest mark since June 2, before rallying in the second half to close the day at $4,274.
Daily Chart:
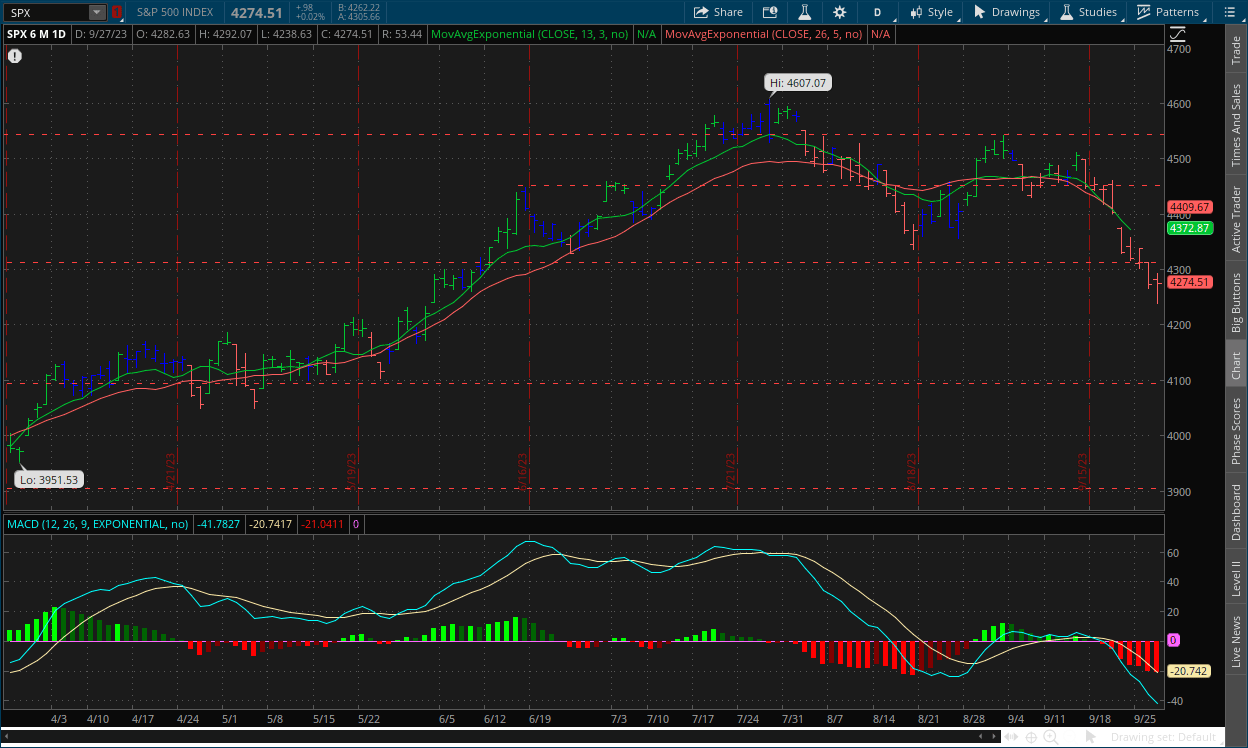
Strength continued to move in favor of the bears for the eighth straight session, as they tightened their grip further on markets. Inertia would shift more in favor of the downside on the front end, but they still have some work to do on the back end.
Despite the flattened close, prices still made new lows on the day fairly strongly, although it was a failed bear raid which typically means prices will rebound for the next day or two. That will likely be the case, but we don’t see it sticking. We will have some consolidation at some point, to which I’ll then reassess the outlook, but for the time being the three market forces are still aligned in the bearish direction.
II-III
Small Cap Warning Signal:
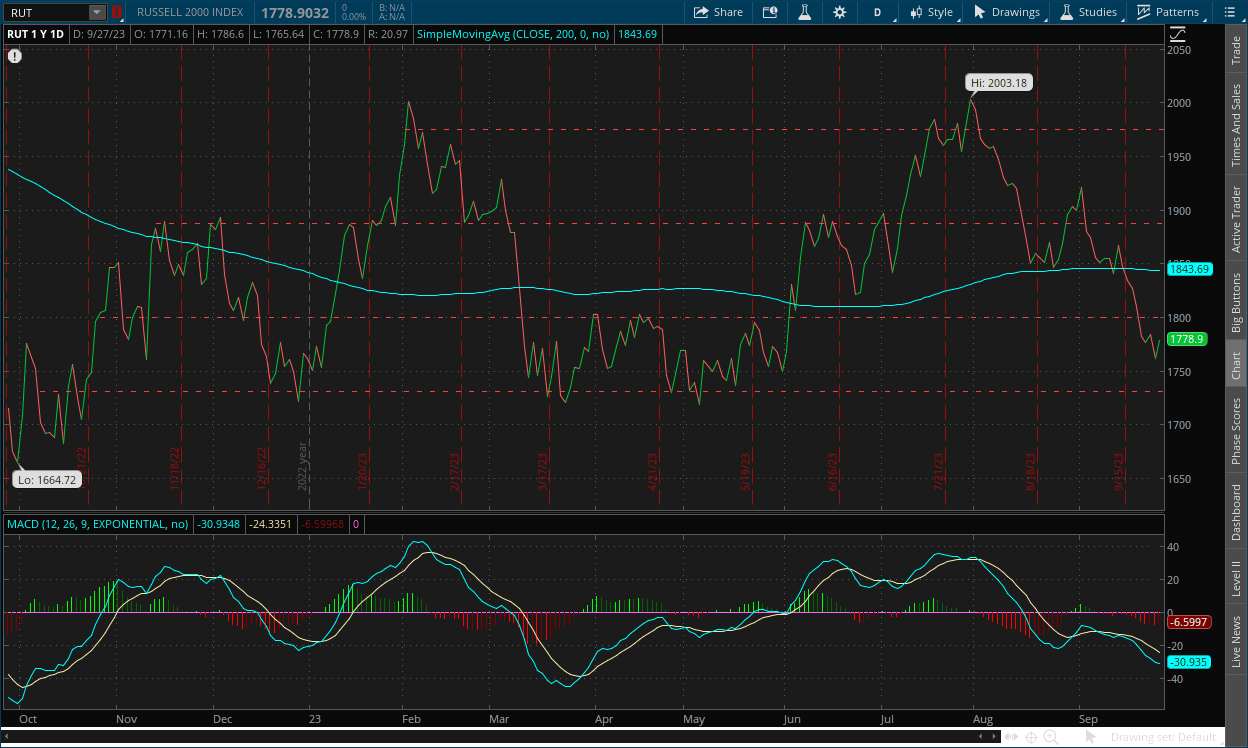
The Russell 2000 small cap index confirmed a move towards a bearish trend after breaking below key support levels, as the outlook for small caps is fairly negative as we head into the fall season.
So Far This Year:
The index has largely been stuck in a trading range this year, even as the broader S&P 500 and the Nasdaq have risen sharply. The Russell 2000 is only up 1.2% so far in 2023, while the S&P is up 13%, and the Nasdaq 34%. Despite that, small caps have fallen more steeply than large caps over the past month as economic uncertainties grow, and participants worry about the higher for longer narrative, which as we've discussed, affects smaller companies much more than larger ones (see 9/6/23 report).
The Signal:
The index has truly broken below the 200-day moving average a total of 3 times over the last year. It traded below the average for most of 2022, and the first 2 breaks on the far left were a return back to the trend following the rally. The second break however was during the banking crisis, but as we know markets swiftly brushed that off, as the thought of rate cuts immediately overtook markets, and the third break was earlier this month. The bearish divergence in the MACD-H over the summer is what led to the move, as was the case in the larger indexes as well. Prices moved higher while the MACD-H (strength) traced lower with each new cycle above the centerline, until finally it broke.
Small caps breaking below the moving average, is a broad market warning sign because small caps are deemed to be the most sensitive to a recession. These are your riskier stocks that you trade when they become a meme or have a lot of hype surrounding them. They’re weaker companies, with 99% of them not having good long-term prospects at all, but people buy into them hoping to make quick and accelerated returns, i.e. they’re the most speculative stocks in the market. When things are good, small caps normally outperform the large caps, sometimes to a significant degree. But when things are bad, small caps are the first ones to sell off, and sell off the most due to the risky and speculative nature that surrounds them, and because these companies are the most likely to go under if a recession were to take place.
Historical Precedence:
History shows extreme moves lower for small caps often are a precursor for even more challenges on the road ahead. This signal occurred in 2000 just before the Dot-Com bubble, in 2007 and 2008 before the GFC, before the panic in 2011, 2015, and 2018, the crash in 2020, and all of last year, which when you look at it, the chart from ‘22 to now, look similar to ‘07-’08.
The ratio between the Russell 2000 and 1000 is near a 22-year low, and an analysis that was done by SentimentTrader found there wasn’t a lot of reason to expect an imminent or sustained turnaround. Their analysis looked at the times this ratio fell to its lowest level in at least a decade and did so for the first time in at least 30 sessions. “Over the next three months, the total return on small caps exceeded large caps only 3/15 attempts, and those were just barely,” SentimentTrader added in their projections.
When you don’t have small cap outperformance, that is usually a sign that markets are pricing in more fear, and the more fear right now is because of higher for longer, which increases the likelihood of more severe damage in the economy, stocks, bonds and real estate. For right now, inflation is on the right track. Granted there are certain underlying trends to keep an eye on but that’s beside the point. The point is that it shouldn’t have been what everyone was focusing on over the last year, as we've been saying. There is a much deeper rooted and systemic problem that is plaguing not just our economy but the global economy as well. Inflation is a biproduct of this issue and shouldn't be the sole focus of market participants and American citizens.
But to tie that rant up with a bow, the Russell 2000 crossing below that mark, take it as you would a signal front the VIX, i.e. more implied volatility ahead. And if something does ultimately break then you can expect small caps to outperform large caps to the downside.
III
Fundamentals:
III-I
Headlines:
1.) MarketWatch: ‘Extreme fear’ has returned to the stock market
2.) MarketWatch: Oil prices edge lower after the US benchmark briefly tops $95 per barrel
3.) Bloomberg: UBS near settlement in Credit Suisse $1.5 billion Tuna bond case
4.) Wall Street Journal: German inflation declines more than expected in September
5.) Wall Street Journal: China Evergrande shares suspended after reports of founder’s disappearance
III-II
Soft Landing Calls:
The Soft-Landing Narrative's "Success" Rate:
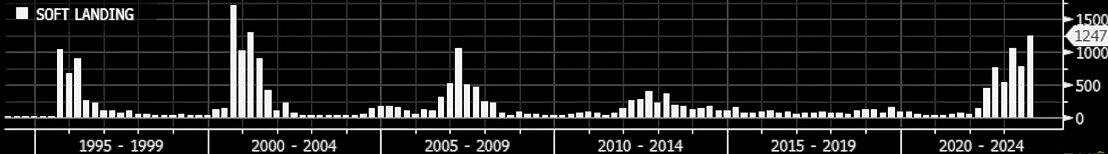
Source: Bloomberg
Throughout the last two years almost, but especially this year, we have heard nothing but ‘soft landing’ shouted at the rooftops by economists, analysts, media, people on Twitter and whoever else. But as history shows, the soft-landing calls have been extremely successful… at predicting recessions.
Soft landing calls have preceded past recessions since the early 1980s when the term was put into circulation. In other words, the consensus soft landing scenario predictions have preceded every major recession since the 1980s. To be fair, the soft landing is wrong most of the time because something breaks suddenly. But our thought process behind the current economic situation is that we have historical precedence for something suddenly breaking under these circumstances, a black swan, whatever you want to call it. So why the flip and optimism from so many economists and analysts?
The Bus Stop Theory:
You’re waiting at the bus stop for the bus, but it’s late. You sit there, and as time goes by you get frustrated and wonder if it’ll ever come. After a while, you get impatient, just say screw it, and start walking. You get a reasonable distance away and start to forget about it. Then you turn around and see the bus at the stop, but you’re too far away to run back and get on.
This analogy applies to economists, analysts and media who all predicted recessions to come but decided to walk away from it as their impatience grew. This applied to economists before 2008, 2001, the early 1990s, the 80s and beyond. It’s just another small pattern that repeats itself throughout history and one of the reasons why we haven’t changed our tune. Granted, the bus still hasn’t come yet, but it makes you wonder with everything starting to line up, is it almost here, or is it another head fake? There is an asset bubble in U.S. stocks, as well as a massive debt bubble in the U.S. economy and we think it's hard to even argue against the notion that these will pop sooner rather than later. But sooner rather than later relative to how these things move could still be years away. That's why being nimble, fluid, and managing risk in the current market environment will be so crucial moving forward.
IV
Market Psychology & Final Thoughts:
Futures have begun to sell off as we head towards the open after remaining marginally higher for most of the premarket. Crude has dipped from its $95 high, while European markets are gaining as well as bond yields. Despite the dip, markets will likely be a little quieter today but we’ll see. The GDP estimate comes out this morning as well as the weekly jobless claims data. Tomorrow we'll go over the GDP estimates barring something that happens that would take precedence. We hope you found our quick rants helpful, learned something, and have a real solid Thursday.