The Take Five Report: 9/25/23
I
Markets:
I-I
Global Market Recap:
United States:
- S&P: -0.23%
- Dow: -0.31%
- Nasdaq: -0.09%
- Russell 2k: -0.30%
U.S. indexes would open the day on a positive note. Stocks would slightly rally through the first half of the day but make very little progress. Markets would begin to flatten, and finally sell off in the latter half of the day, and it would last through the close with major indexes finishing with marginal losses.
Asia:
- Shanghai: -0.54%
- Hong Kong: -1.82%
- Japan: +0.85%
- India: +0.02%
Asian markets were mixed as they look ahead to a week of inflation data. Singapore and Australia are reporting their figures for August later this week, while Japan will release data for Tokyo, which is seen as a leading indicator for the rest of the country. The U.S. will also be reporting PCE data on Friday.
Europe:
- UK: +0.07%
- Germany: -0.09%
- France: -0.40%
- Italy: -0.46%
European stock markets were largely falling on Friday as the latest economic data showed business activity in the euro zone currency bloc contracted in September, although at a slower pace than previously. Eurozone PMI rose to 47.1 in September from 46.7 in August. However, it remained below the 50 mark that separates contraction from expansion.
I-II
U.S. Sectors Snapshot:
- Communication Services: -0.09%
- Consumer Discretionary: -0.87%
- Consumer Staples: -0.47%
- Energy: +0.15%
- Financials: -0.74%
- Health Care: -0.19%
- Industrials: -0.34%
- Info Tech: +0.26%
- Materials: -0.13%
- Real Estate: -0.72%
- Utilities: -0.16%
II
Technicals:
II-I
Volatility Index: (VIX)
Weekly Chart:
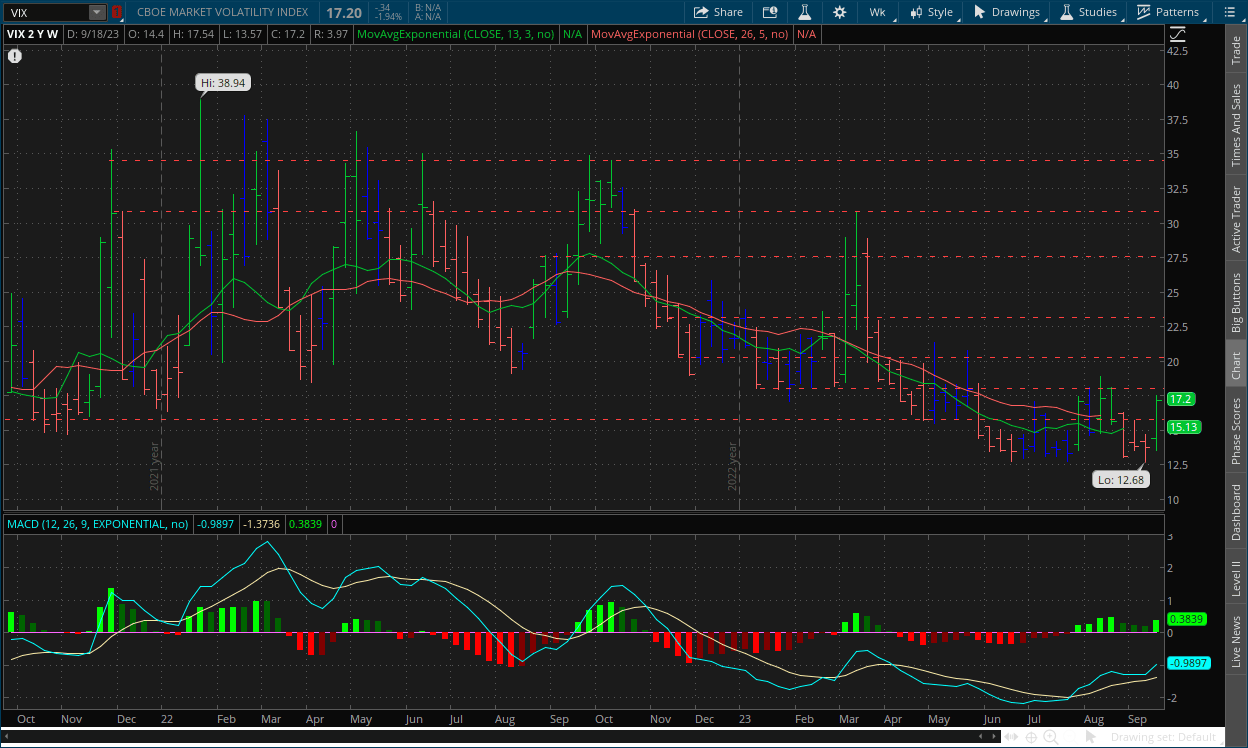
The VIX opened the week at the high end of its trading range at $14.40. Prices would slide to the lower end of the range and reach a weekly low of $13.57. Prices would then skyrocket following the FOMC meeting on Wednesday and shoot to a high of $17.54 on Thursday before closing the week off at $17.20.
Strength after moving back in favor of the VIX bears for three weeks, jumped back in favor of the VIX bulls, nearly reaching this cycle’s high point. Inertia shifted to the upside on the front end, but on the back end it’s still largely favoring downward.
The triple divergence’s activation, while we thought might've had a chance to be whipsawed like the others given that the MACD Lines aren't showing a divergence along with the MACD-H, that didn't end up being the case. We said that barring any positive fundamental catalyst, the activation of the signal should create a powerful move to the upside for the VIX and that’s exactly what it seems to be doing. As the VIX continued to downtrend, the strength of the VIX bears kept becoming weaker, until it finally reached a breaking point. With the psychological force finally lining up with the bearish signals, especially to this degree, a more significant move to the upside for the VIX and downside for the S&P is the very likely outcome. A divergence is a signal that takes into account the underlying psychology, but most across the last few months have gotten whipsawed because of the markets’ bizarre reactions to things happening within the fundamental force.
Daily Chart:
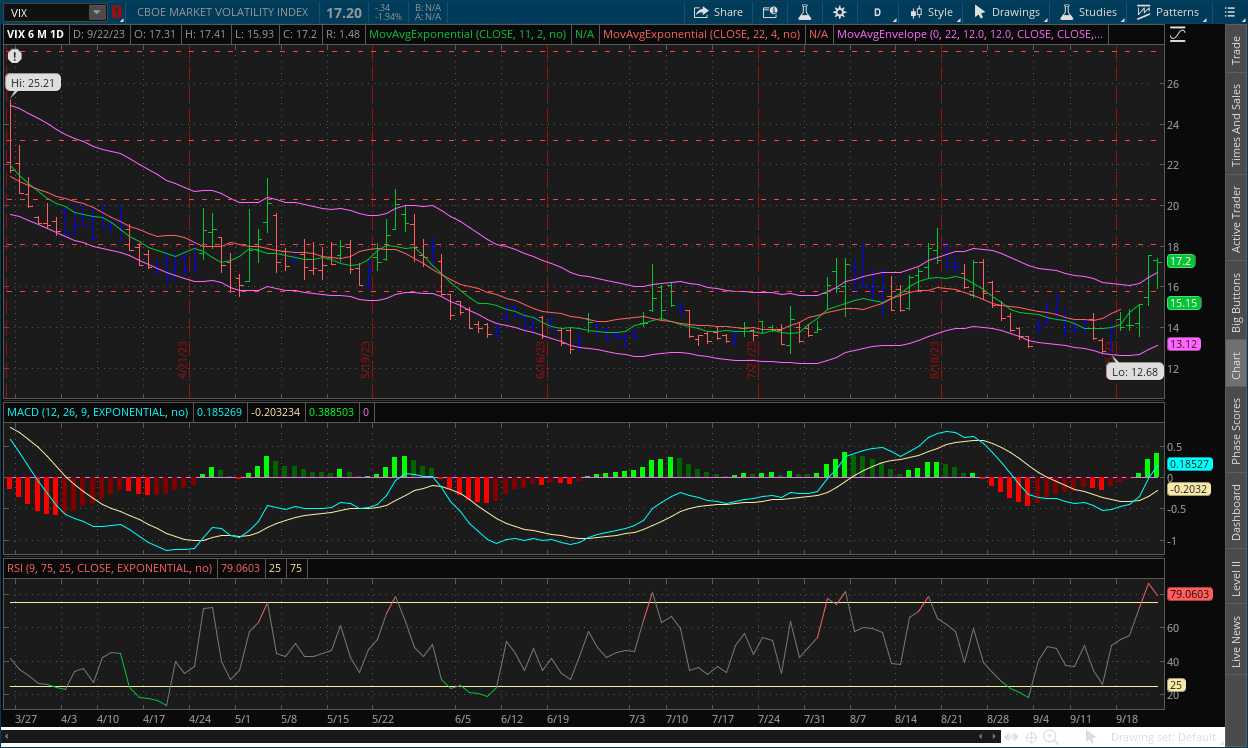
Strength continued to move in favor of the VIX bulls in Friday’s session and is one more jump away from creating new highs during the daily chart’s six-month time period. Inertia continued to move sharply towards the upside on the front end, but again more work needs to be done for longer in order to truly shift the trend.
A failed bear raid back to the $16 support level occurred on Friday, as you can see with the long downward tail, but the VIX bulls managed to bring prices back and close near the high of the day, creating the failed raid pattern. This usually entails that prices will break in the opposite direction of the failed raid for a short period of time, and given how the signals are setting up, this may persist for longer.
II-II
S&P 500: (SPX)
Weekly Chart:
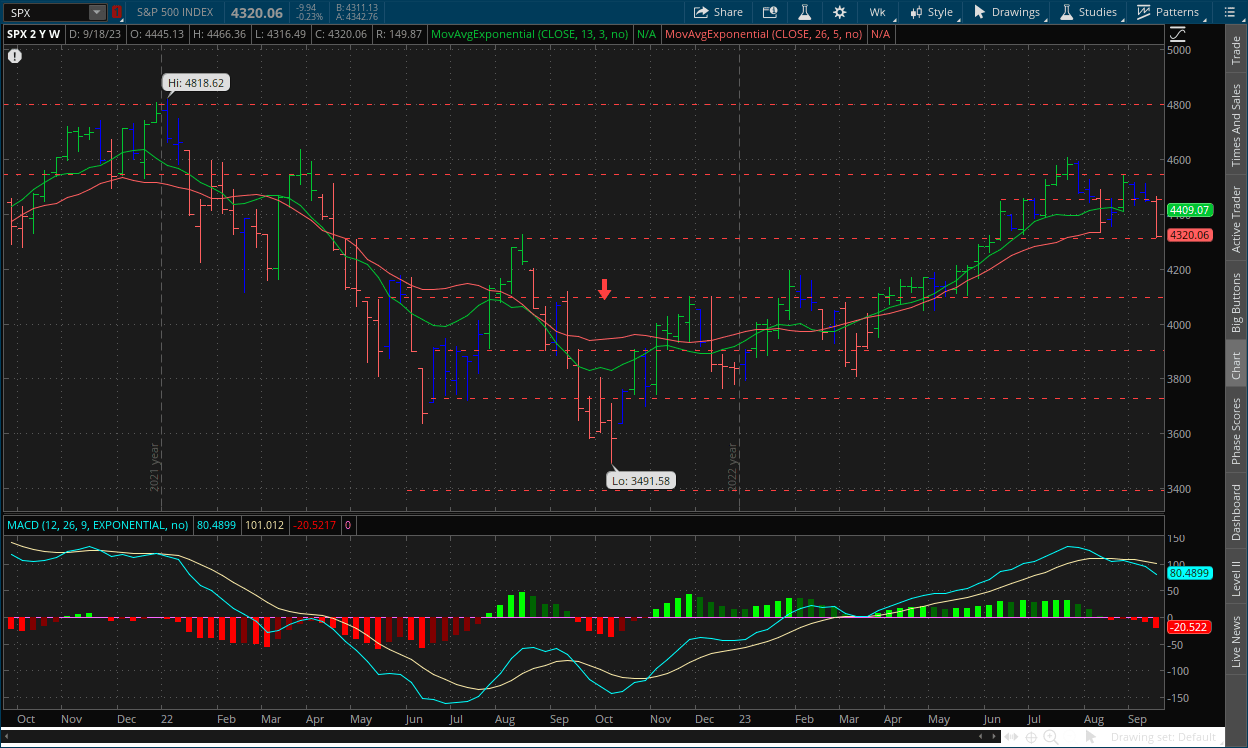
The S&P opened the week slightly lower than the previous at $4,445. Prices would only reach a high of $4,466 before the drop. A low of $4,316 would be reached in the latter part of the week before closing at $4,320.
Strength would continue moving in favor of the bears as they gain more ground back against the bulls. Inertia, while favoring the bears on the front end, still overwhelmingly favors the bulls as it pertains to the larger trend.
As for the weekly chart, the next major test resides in the $4,300 level, which prices were ultimately held above before Friday’s close. The MACD-H hasn’t been below the centerline for some time, and a correction is long overdue. The bears have momentum and the three forces working in their favor now.
Daily Chart:
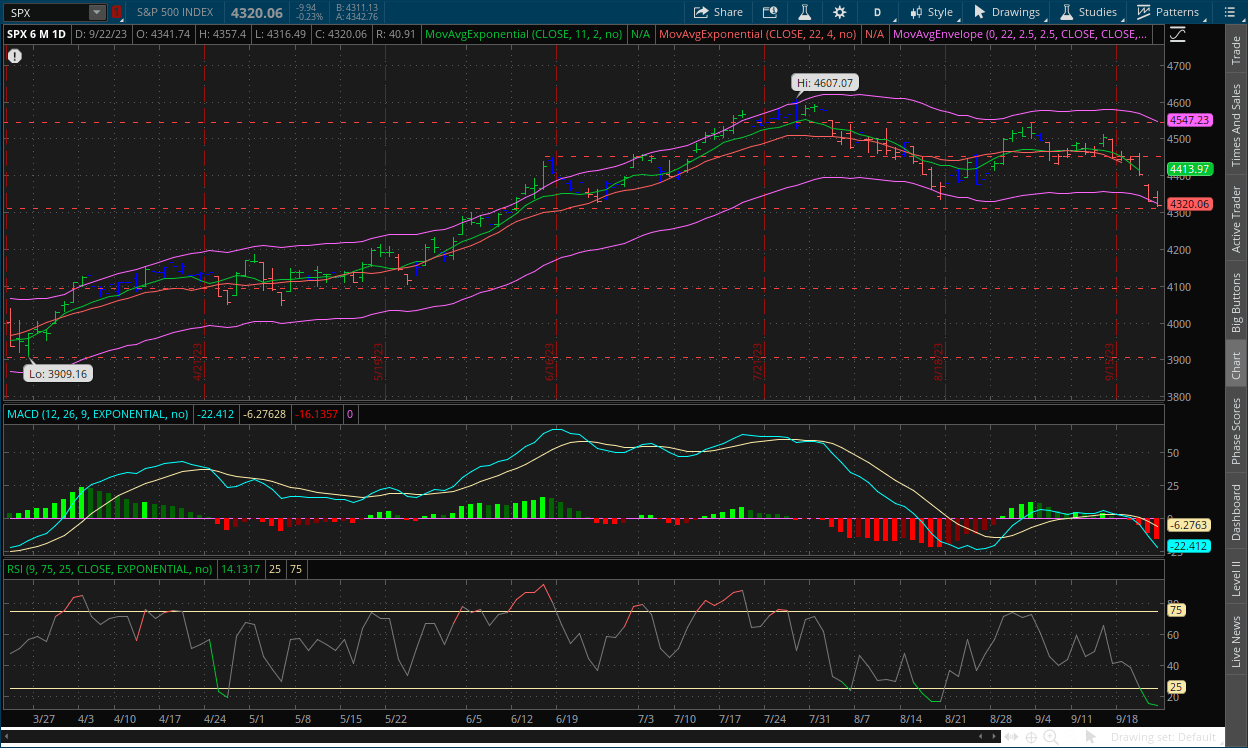
Strength moved in favor of the bears once again as the indicator is nearly at its previous cycles’ low with only five days below the centerline. Inertia is favoring the downside on the front end, and on the back end it has turned mostly flat as prices have been mostly stuck within a trading range over the last two months.
The multiple breaks below the $4,450 support level and only one stab at the $4,500-$4,550 resistance level showed that price action was much more eager to move towards the downside, it’s just that stubborn bulls we’re getting in the way of the bears. But with the Fed’s ultimate drop the mic moment, i.e. *higher for longer*, which finally is sticking in the heads of markets, prices finally were able to successfully break below that level and move all the way down close to the $4,300 level, which again is the next major test. As we've said before, when a technical indicator makes a multi month high/low (low in this case), the trend is likely to persist.
III
Fundamentals:
III-I
Headlines:
1.) MarketWatch: China Evergrande’s shares fall as developer scraps restructuring plan
2.) MarketWatch: UAW expands strike to 38 GM and Stellantis auto parts distribution centers in 20 states
3.) Bloomberg: Saudi Arabia takes a step closer to achieving nuclear power
4.) Wall Street Journal: Hollywood writers reach agreement with studios, ending strike
III-II
The Week Ahead:
Consumer Confidence for September - Final Reading:
|
Index: |
Prior: |
Wall Street Expectations: |
Take Five Expectations: |
|---|---|---|---|
|
Consumer Confidence: |
106.1 |
105.0 |
100 |
The August read for consumer confidence took a fairly heavy hit from July’s figure of 114.0 (which was downwardly revised from 117.0), as markets were growing increasingly more on edge. This holds some particular importance this week and may be the key report for the week as well. There’s more fear starting to drip into the markets from all sides, and a weaker consumer confidence figure will likely add even more selling pressure. Wall Street’s estimates are the best-case scenario. Our estimate of 100 might even be a bit on the safer side, and it wouldn't shock us if the number comes in below that but it’s hard to say how much the last week will affect the report. Either way, expect this to come in below the prior.
New Home Sales for August:
|
Index: |
Prior: |
Wall Street Expectations: |
Take Five Expectations: |
|---|---|---|---|
|
New Home Sales: |
714k |
695k |
680k |
In Friday’s report, we went over the current state of the real estate market but hyper focused our attention onto Wall Street’s real estate giants and the trends we were seeing from them, as they’re a very reliable leading indicator of the overall market’s direction. New home sales and the reports’ overall trend is also a leading indicator for the real estate market as mentioned in Friday’s report as well. Seeing the trends from institutions, in this report and others, as well as some anecdotal information we've heard, this number will likely fall in the coming months even more based on our analysis. The past six releases have all been revised down to a fairly large degree, and this trend will likely continue and will be an important indicator of potential issues to come.
GDP for Q2 - Third Estimate:
|
Index: |
Prior Estimate: |
Wall Street Expectations: |
Take Five Expectations: |
|---|---|---|---|
|
GDP: |
2.1% |
2.1% |
2.0% |
This is only an estimate of Q2’s final read, but it will be important nonetheless. We're expecting estimates to come in a little softer than Wall Street’s expectations but not change too much. The first estimate was 2.4%, while the prior was revised down to 2.1%. The report will likely have an impact on the market direction for the day and the week depending on how it comes in. Another thing to watch out for are revisions to prior reports, specifically downward revisions to prior quarters. Markets will likely react negatively to a positive read and vice versa. Please remember and we can’t stress this enough: The Fed’s dual mandate isn’t GDP and price stability (i.e. low inflation), it’s maximum employment and price stability. They only care about inflation to the extent that it affects GDP, e.g. 2021 with supply chain issues and insane amounts of money printing fueled GDP growth, which is not the case anymore. We can still have good GDP growth and lower/falling inflation, as was the case for the thirty years prior to 2021, excluding a few recessions of course.
PCE Report for August:
|
Index: |
Prior Estimate: |
Wall Street Expectations: |
Take Five Expectations: |
|---|---|---|---|
|
PCE: |
0.2% |
0.4% |
0.6% |
|
PCE Core: |
0.2% |
0.2% |
0.4% |
|
Personal Income: |
0.2% |
0.5% |
0.4% |
|
Personal Spending: |
0.8% |
0.5% |
0.7% |
The Fed’s preferred inflation gauge is the final inflation report released for August. This well set the tone for Friday’s session and for early next week. Based on the CPI and PPI, the PCE is bound to come in hotter than expectations as well. In the prior report, headline and core PCE came in at expectations, but the concern was a cooling off in income and a rapid rise in spending, or in other words, spending rising at a much faster clip than wage growth, as this can be a leading indicator of inflation. Wall Street expectations for the August data have income and spending rising at an even pace, but we think that’s unrealistic given the reads we got for CPI and PPI and obviously the energy component within them, and even if income rises at their 0.5% forecast, spending is bound to come in hotter.
UAW Strike:
What to watch out for in terms of this are any offers made by any of the companies involved and the reaction by the UAW, as well as any sign of escalation. On Friday, UAW president Shawn Fain said the union would double down with GM and Stelantis, and said an additional 5,625 UAW members will be striking at certain respective plants starting on that day, bringing the total up over 18,000, saying they are “prepared to strike for months''. However, they did credit Ford for making progress in negotiations.
IV
Market Psychology & Final Thoughts:
Futures are edging down marginally in the early premarket, but the VIX is skyrocketing and is trading above $18. Crude futures are trading down this morning as well, which is a good thing, but bond yields are on the rise and European markets are falling significantly.
We will reiterate again, the higher for longer message has finally been burned into the heads of market participants. This has them in a state of panic, as higher for longer means there is more time for something to break, a valid reason to panic. This week will be interesting, as there are a lot of moving pieces and a lot of potential catalysts. Tomorrow we'll do a breakdown of a potential government shutdown in the next week or so that could also panic markets even further. As always, we hope you found this helpful, learned something, and have a kick ass Monday.