The Take Five Report: 8/21/23
I
Markets:
I-I
Global Market Recap:
United States:
- S&P: -0.01%
- Dow: +0.07%
- Nasdaq: -0.20%
- Russell 2k: +0.51%
U.S. markets on Friday opened low as premarket volatility was high. Markets would steadily rally throughout the day however, bringing all major indexes close to a breakeven finish. Interestingly however, small cap activity within the Russell 2000 index outpaced the larger market.
Asia:
- Shanghai: -1.24%
- Hong Kong: -1.82%
- Japan: +0.37%
- India: +0.44%
Asian markets were mixed overall as China cut its one-year loan prime rate (LPR) but kept its five-year rate unchanged. The one-year LPR was cut by only 10 basis points however, down to 3.45%, with the five-year remaining at 4.2% which serves as a peg for mortgages.
Europe:
- UK: -0.65%
- Germany: -0.65%
- France: -0.38%
- Italy: -0.42%
European markets retreated on Friday, as global sentiment remains cautious to say the least following the US’ fed minutes, Japan’s CPI print and China’s real estate giant, Evergrande, filing for Chapter 15 bankruptcy. The UK and Germany would pace decline for the major markets in the region.
I-II
U.S. Sectors Snapshot:
- Communication Services: -0.98%
- Consumer Discretionary: -0.32%
- Consumer Staples: +0.37%
- Energy: +0.94%
- Financials: -0.13%
- Health Care: -0.01%
- Industrials: +0.12%
- Info Tech: +0.11%
- Materials: -0.08%
- Real Estate: +0.28%
- Utilities: +0.39%
II
Technicals:
II-I
Volatility Index: (VIX)
Weekly Chart:
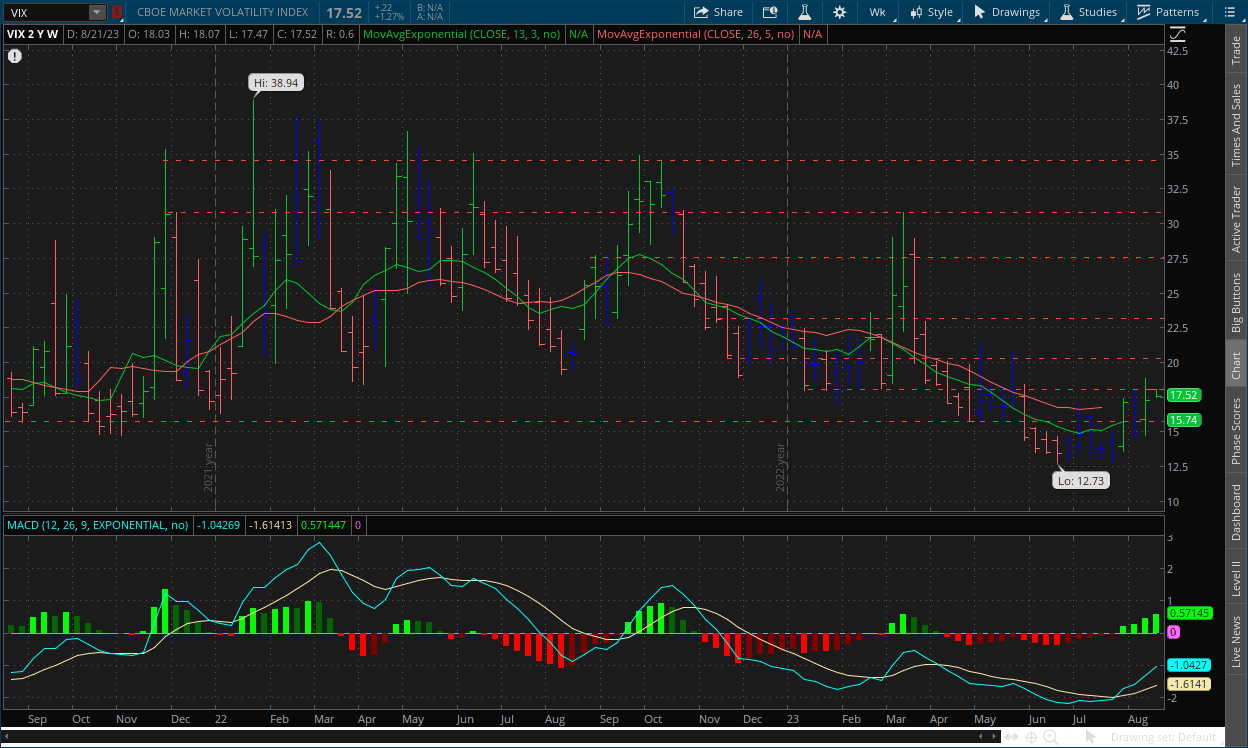
The VIX would close last week with a high of $18.88 made in Friday’s session, and ultimately cap the week off down from that mark at $17.30 after a false breakout above the $18.07 level saw prices slide back downward. Inertia would move more in favor of the VIX bulls once again following last week, and is now edging up at about a 20 degree angle. Strength on the weekly chart also continued its push upward for the third consecutive week after the activation of the triple divergence, with the MACD Lines gaining more separation from one another.
We still remain cautious of the Hound of Baskerville signal but as time goes on, the signal looks less and less likely to occur. The VIX is overdue for a reversal of this overall downtrend, and we expect elevated prices seen over the last couple of years being difficult for the VIX bears to keep down at this current moment in time.
Daily Chart:
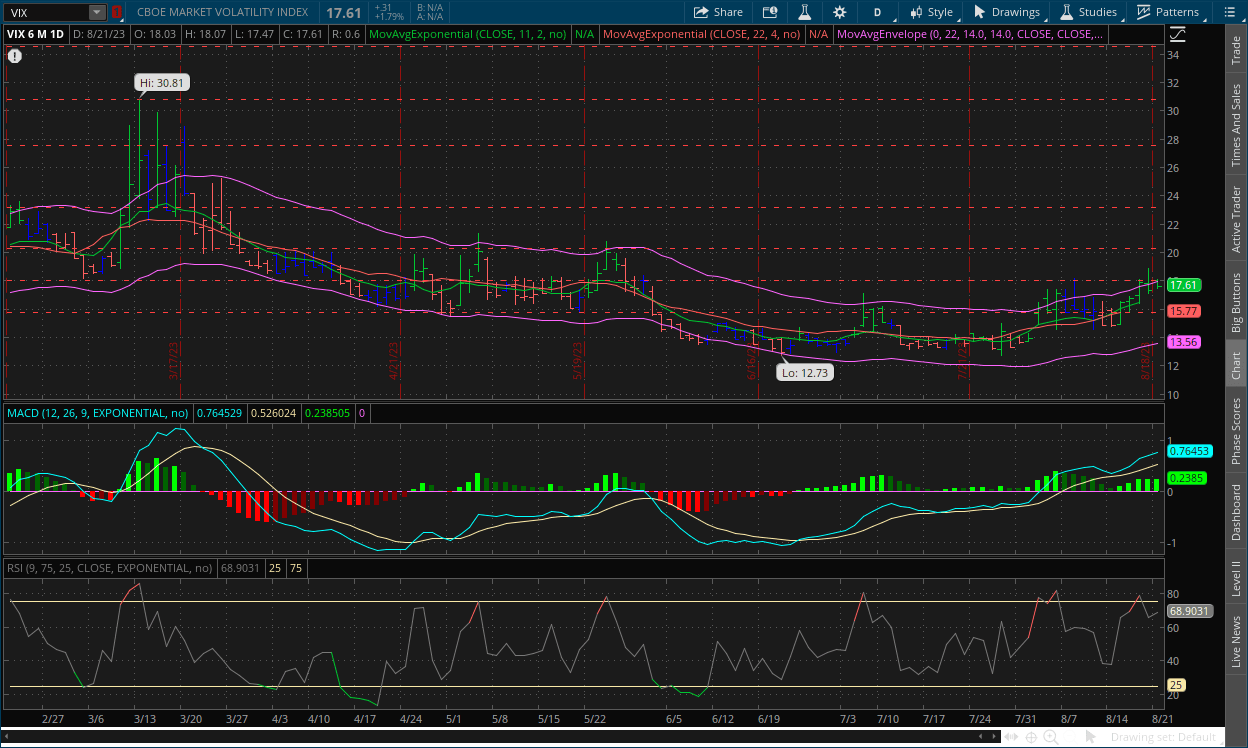
Inertia would continue its upward momentum following Friday's session, as the VIX bulls continue to make it harder and harder for the VIX bears to shift inertia back in their favor. Strength moved in favor of the VIX bulls for the fourth straight session, albeit slightly its momentum was tempered. Prices are hitting resistance at the $18.07 mark, which we suggested may ultimately be the case. This resistance level is relatively minor compared to others, so the bulls will likely need less in order to cause a true breakout, but will still need to prove themselves either way.
II-II
S&P 500: (SPX)
Weekly Chart:
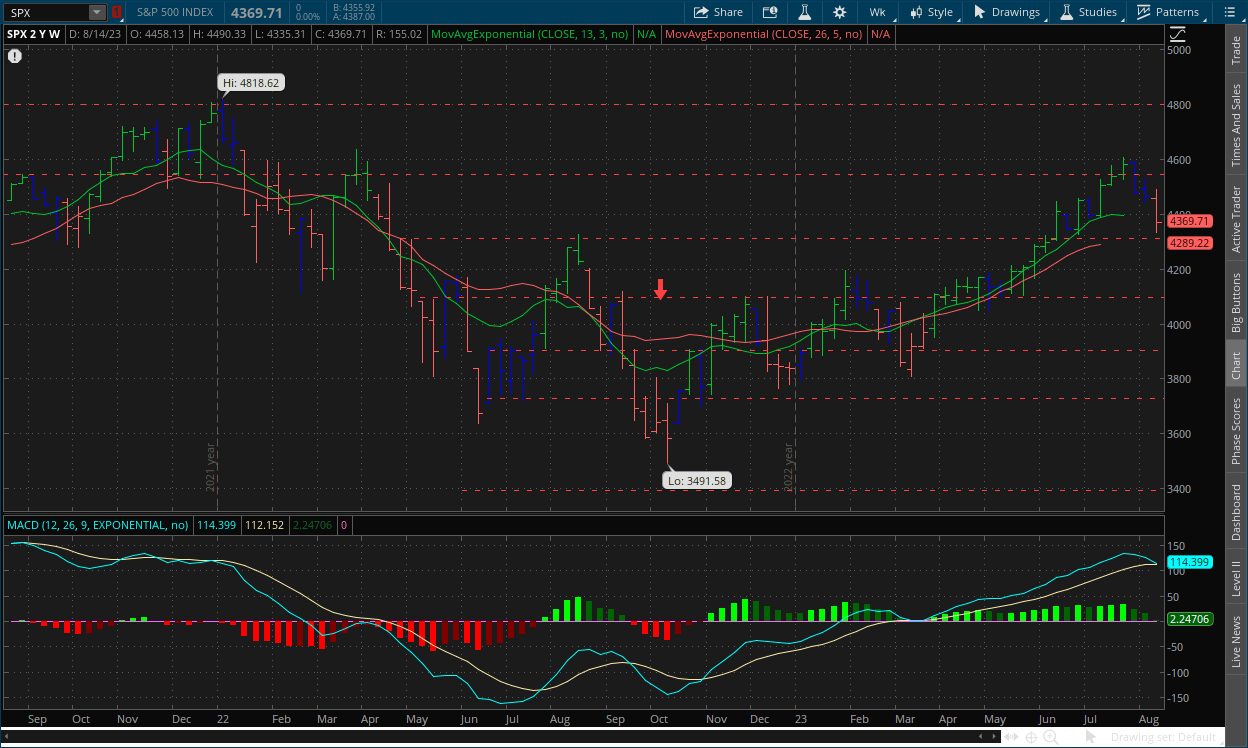
The S&P would close last week at $4,369, logging its largest drop since early March. Inertia isn’t quite in full favor of the bears yet, and remains mostly flat with a slight edge down, but is slowly starting to move in that direction. Strength would move in favor of the bears for the third consecutive week, as they’re now extremely close to shifting it back in their favor and starting a new cycle below the centerline, on the much stronger weekly chart.
Daily Chart:
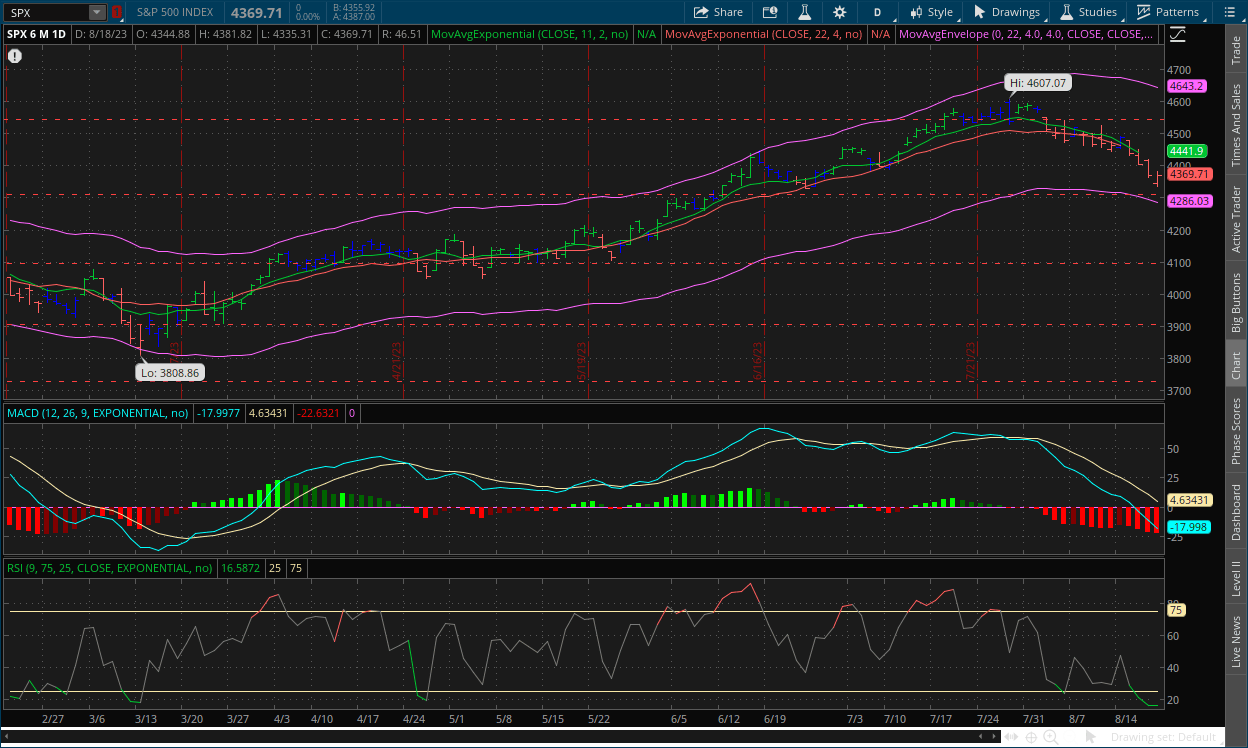
Inertia would continue to gain more momentum towards the downside. Although we haven’t seen it fully shift in the bears’ favor on the weekly chart, it is fully in their favor on the daily. Strength continued to push in favor of the bears as they continued their extremely strong cycle below the centerline. We may begin to see the start of either some form of consolidation, or a pullback to the nearest point of resistance which would be either $4,400 or $4,450. We should have a better estimate after today and tomorrow’s sessions.
III
Fundamentals:
III-I
Headlines:
1.) MarketWatch: The history of companies with Nvidia-like valuations isn’t a good one
2.) MarketWatch: Rising yields put S&P 500 on pace for biggest monthly loss of 2023 as investors brace for Powell’s Jackson Hole speech.
3.) Bloomberg: Chinese stock rout sparks buying pledges by Mutual Funds
4.) Bloomberg: Warehouse costs rise 10%, with London being the most expensive globally
5.) Financial Times: China hits the East Asian demographic wall
6.) Fortune: Legendary investor Ray Dalio has always been a fan of China - but even says it’s overdue for a debt shake-up
III-II
Why Are Money Market Funds Seeing Massive Inflows?
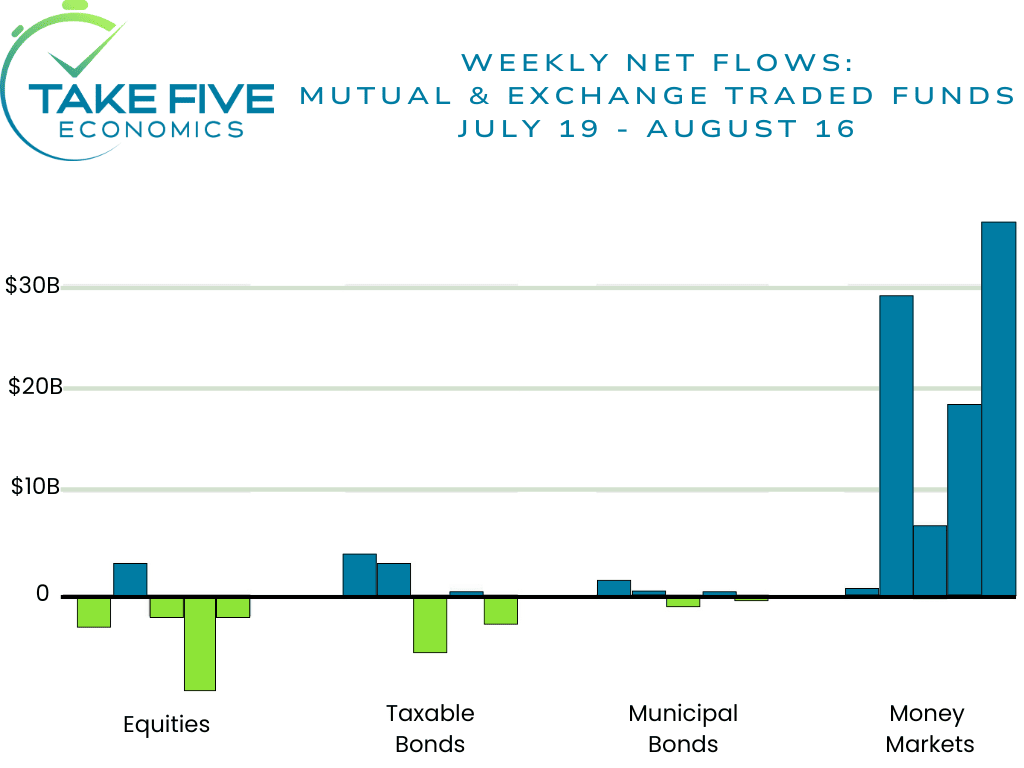
One of the most important pieces of information to know about the market environment is where the money is going, as it gives us insight into the minds of market participants and their thoughts on stocks, bonds, and even real estate. Over the last few weeks, the data flows show that investors have pulled $11.6 billion from stock funds since July 19, while putting $91.6 billion into money market funds, according to data as of Wednesday Aug. 16.
Why is This Interesting?
For those who don’t know, a money market fund is an open ended mutual fund that invests in short term debt securities such as Treasuries or commercial paper, and are managed with the goal of maintaining stable asset value through liquid investments, while paying investors in the form dividends/yield. With that being said, most money market funds are offering higher yields than short term treasuries. This begs the question of; what is the point of investing in treasuries yourself, when you can have 100% liquidity with “limited” risk inside of a money market fund?
Consider this: Say you have a few stock investments but stocks start trending down, you then sell out of those positions and have cash. Instead of sitting on cash, you decide to buy yield to which then you have two options; a.) buy short term bonds which have more risk associated with them and are less liquid because you’re more likely to hold the bond to maturity rather than sell it early and risk losses on the issue if yields were to continue to rise, or b.) buy into a money market fund which have less risk associated with them, are 100% liquid, i.e. you can move capital in and out at will, and offer a higher yield than short term treasuries.
Money market funds are offering 4.5%-5.5% yields, while the 2-year treasury is yielding 4.971% or the 10 year that yields 4.301%. Granted we will admit that the shorter-term treasuries are offering higher yields, with the 1 month offering 5.395%, and the 3-month offering 5.450% currently. But because of the “market risk” attached to them, and the feeling of being less liquid (which is the main reason as far as we can tell), investors are sacrificing a few basis points of yield and favoring the money market funds because of their liquidity. If stocks turn downward, a money market fund is a perfect place to park your capital until stocks begin to turn again.
How Money Market Funds Are Getting Such High Yields:
The question then becomes how the MMF’s are able to offer such high yields. If there’s limited to no market risk attached, then they’re not getting them from treasury bonds. They’re actually getting them directly from the Federal Reserve.
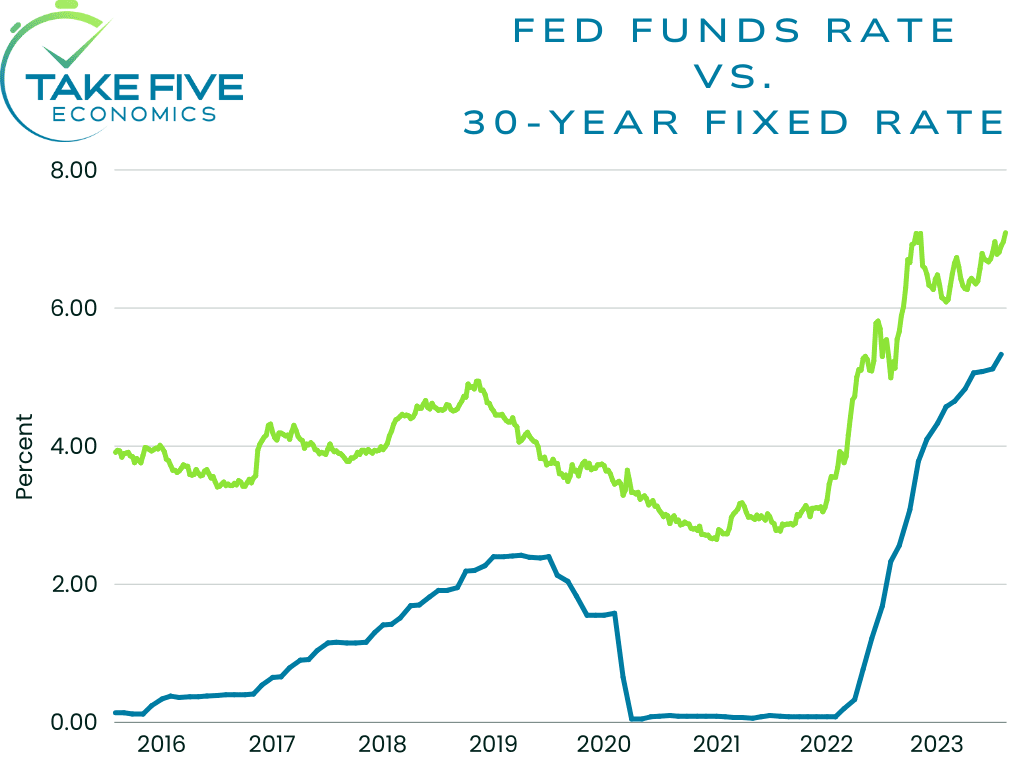
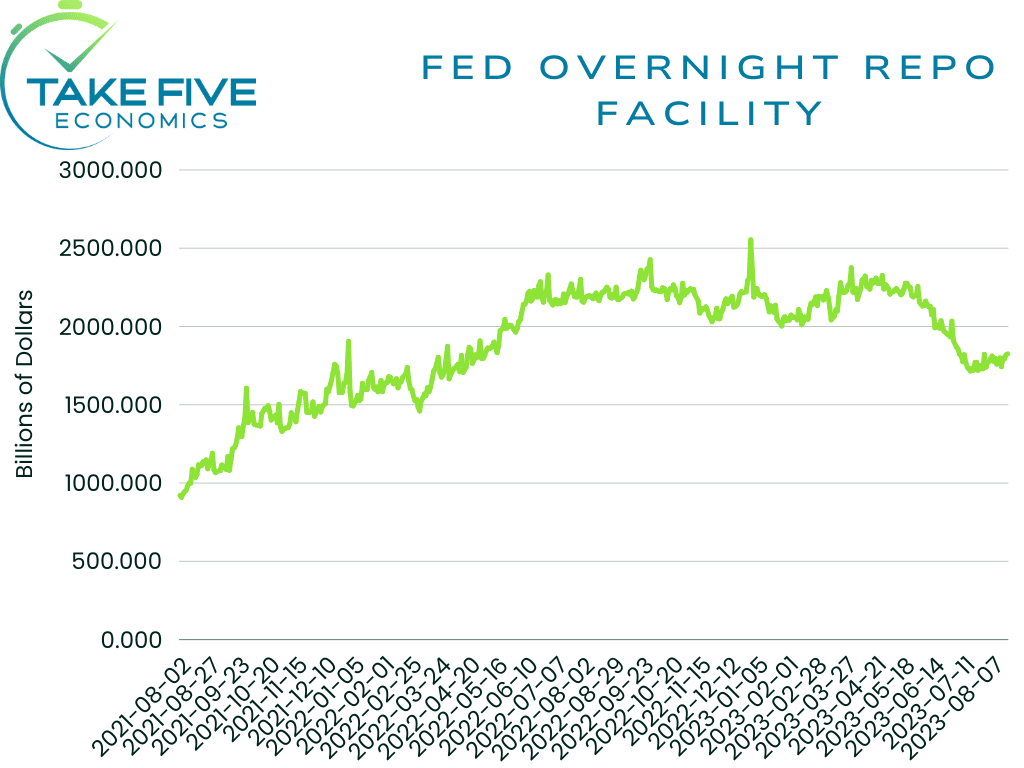
The Fed’s current target rate is 5.25%, which sits right in between the two year and six month treasury bonds. The money market funds then have the choice of deciding between getting liquidity from Treasuries, or directly from the Fed’s repo facility, which offers instant liquidity because it is an overnight lending tool used by banks, who are the ones who manage money market funds.
The Fed’s repo facility has been slowly getting drawn down due to quantitative tightening (i.e. rising interest rates) over the last year and half or so. If capital is starting to flow back into the repo facility from these money market funds, then the decline would likely be slowed, flatten out, or even start rising. The Fed is draining an estimated $80 billion per month from the fund and as we know, $91.6 billion has been moved to MMF’s since July 19. As of July 19, we can see exactly that when looking at the chart, showing how MMF’s are getting their yields and liquidity.
What Does This Mean for Stocks & Bonds?
We believe this creates more of a bearish scenario than a bullish scenario for equities and debt securities. As investors continue to allocate away from bonds and into money market funds, yields will continue to rise and bond valuations will continue to fall. The same is true for stocks, if people continue closing and/or reducing equity positions and allocating into MMF’s, prices will continue to fall. As prices fall and yields rise more, it creates a self-fulfilling prophecy and a downward spiral as time goes on. If the market does have some sort of correction following this year's rally so far like we believe it will, this will be one of the contributing factors. It would also create a “buy the dip” scenario later on down the line and provide fuel for a strong rally if there's a lot of capital parked on the sidelines waiting for another shift back to the upside. For the time being as we've been saying, we believe the bears will ultimately overwhelm the bulls sooner rather than later.
IV
Market Psychology & Final Thoughts:
Futures are starting to sell off as we head towards the open, but are still largely up, meaning this week will likely start off on a positive note. Bears still have full control over equities and bonds, but we may start to see bulls bring prices back to a previous point of resistance and force prices to start a consolidation period. Today will give us a much better idea of how the rest of the week will fare. There is no major economic data or larger catalysts being reported and/or happening so far today or this week for that matter, so the bulls likely have some room to gain back some ground. As always, we hope you found this helpful, learned a thing or two, and have a great day.