
U.S. Banks... We May Have a Problem
Last week the FDIC released their quarterly banking profile for Q1 of 2024. This report essentially the FDIC's analysis of the U.S. banking system's current stability and given the environment we find ourselves in today, the information it contains is notable. The question is, will we see something similar to what we saw in March of 2023 with Silicon Valley Bank and Signature Bank again?
Good News:
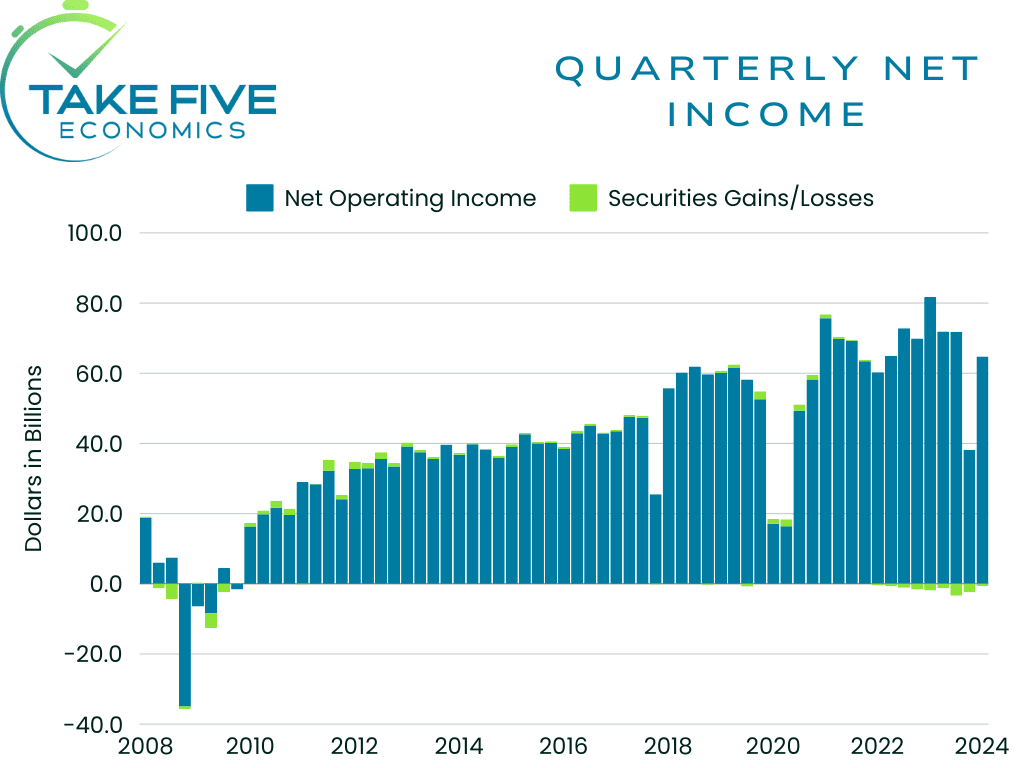
The industry as a whole continued to show its resilience in Q1. Overall net income rebounded from the drop seen in Q4, which was due from an increase in nonrecurring expenses while the industries overall liquidity remained stable.
Net income increased by 79.5% quarter over quarter, mainly contributed by lower expensed goodwill write-downs and the FDIC special assessment, which is the fee the FDIC charges on banks with larger amounts of uninsured deposits. However, without the lower expense, net income would have only increased by 14.3%, per the FDIC. Community banks saw an increase of $6.3 billion in net income, a rise of 6.1% from Q4 of last year.
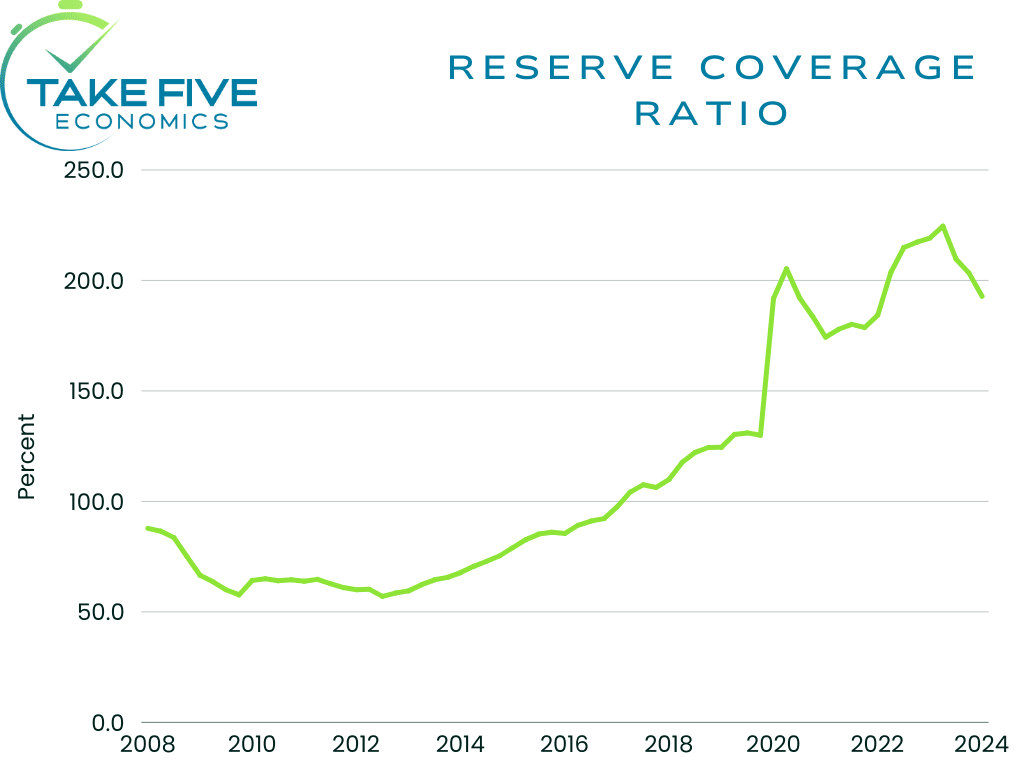
The reserve coverage ratio, i.e. the ability of a company or bank to absorb losses related to troubled loans, fell from 203.3% to 192.8% in the quarter. The good news is that it is still much higher than its pre-pandemic average.
Red Flags:
Unrealized Losses:
One important note to make about this report is that it is from Q1, meaning that the problems are likely to get worse before they get better. This is because the banks that have issues, have them because they have large portfolios of bonds on their balance sheet resulting in record high amounts of unrealized losses.
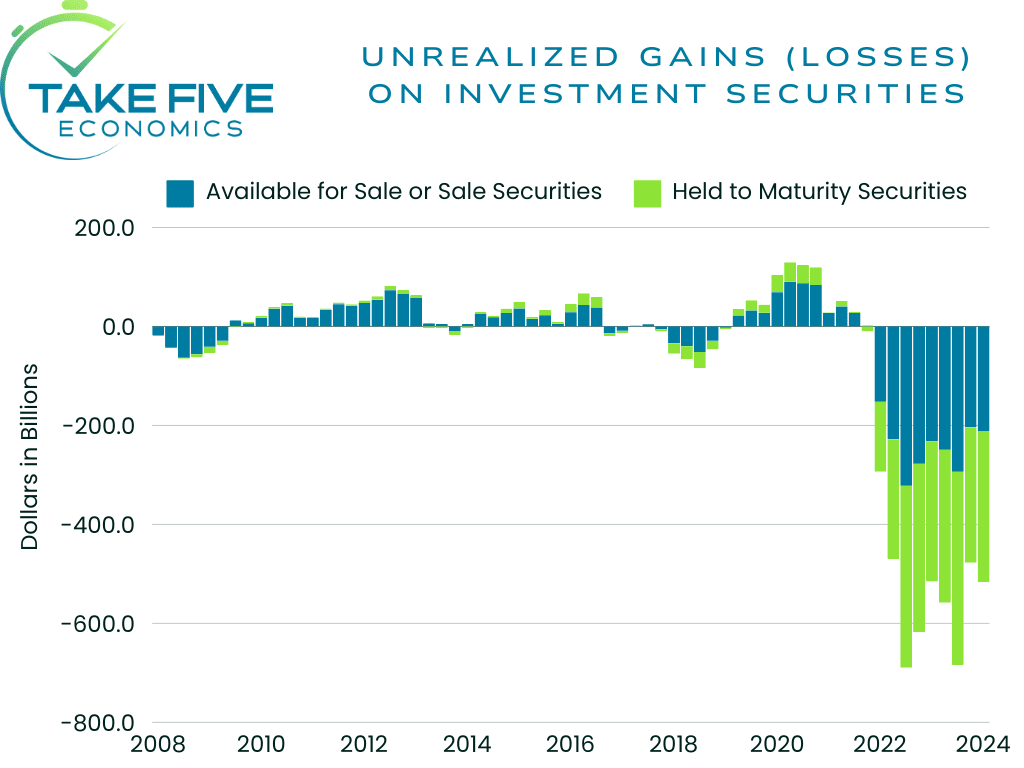
The banks purchased the bonds at a higher price than they're worth today, resulting in the numbers seen in the chart above. Firstly, as a byproduct, this means that many banks have less liquidity than people think they have. Secondly, not all of these losses will show up on the balance sheet due to the way accounting rules work, meaning the securities will show up on the bank's balance sheet equal to the original purchase value rather than the current market value, i.e. mark to market. This is one scenario that can lead to a banking failure because if people were to withdraw their money in droves, the bank will be forced to sell these underlying "assets" (liabilities is more like it) at a loss as they won't have the liquidity to meet the demand. This is what happened during the banking crisis in March of last year with Silicon Valley Bank and Signature Bank.
Unrealized losses increased by $39 billion in Q1 to $517 billion, an increase of 8.15%. Higher unrealized losses on residential mortgage-backed securities, resulting from higher mortgage rates in Q1 drove the increase and it was the ninth straight quarter (or 27 months) into this issue of extremely high amounts of unrealized losses.
Asset Quality:
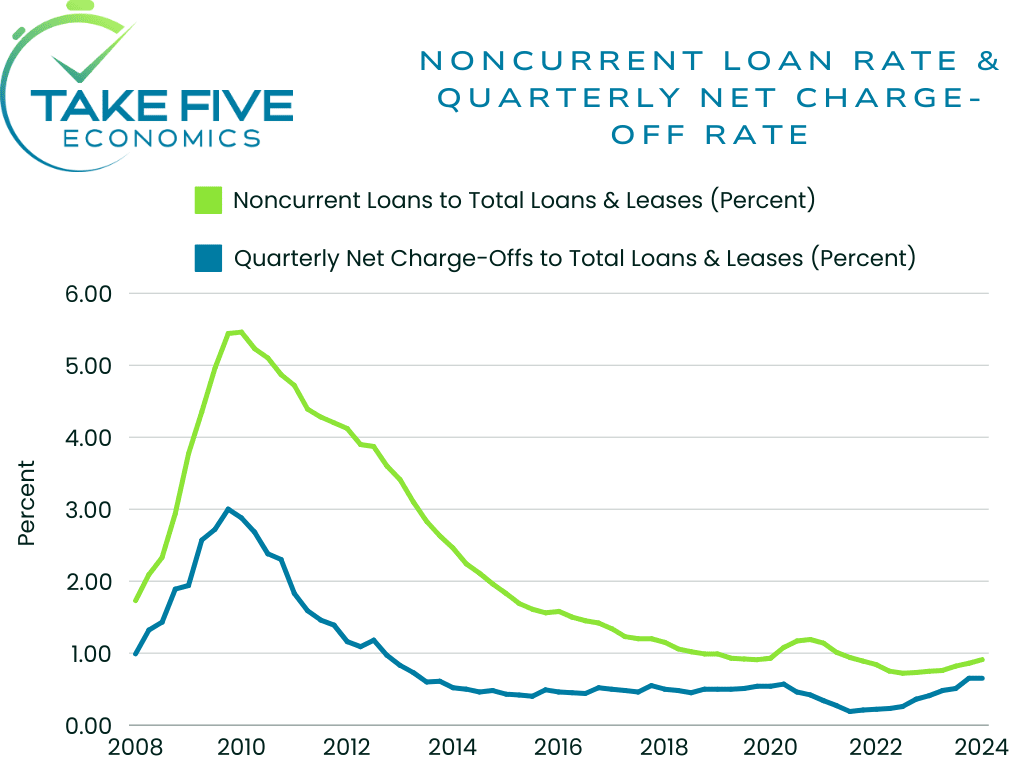
In aggregate, the industry's quarterly net charge-off rate remained at 0.65%, which is good news on its surface because you don't want to see this number tick higher than it already is, in which therein lies a portion of the problem, i.e. that the rate is 24 basis points higher than last years and is at the highest level since Q3 of 2011 which is the important takeaway here. 2011 was the second bottom so to speak in the aftermath of the Great Financial Crisis of 2008.
There was also a noticeable uptick in the amount of write-downs/charge-offs on credit cards specifically, i.e. when a creditor acknowledges that a portion of the debt is unlikely to be repaid, thus lowering the overall value and grade of the debt which contributed the most to the headline figures. The credit card net charge-off rate was 4.70% in Q1, nearly 125 basis points above its pre-pandemic average and the highest since 2013.
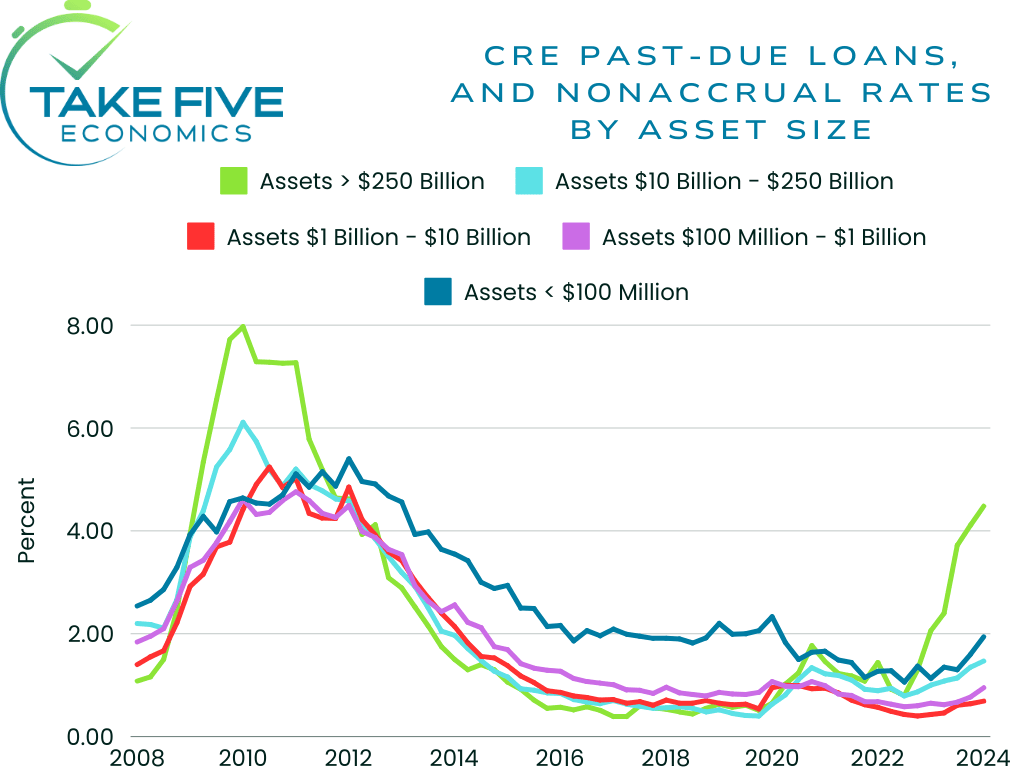
Now focusing on commercial real estate, the upward trend of past-due CRE loans kept the pace in Q1 as the total increased by $1.8 billion, or 9.0% quarter over quarter. The deterioration of these loans has been heavily centered around the largest banks, as they reported a PDNA rate of 4.48% which is about 7.5x above the pre-pandemic rate of 0.59%. The next tiers down are also showing increased signs of stress.
Weaker demand for office space is softening property values while higher interest rates are affecting the credit quality and refinancing ability of office and other types of CRE loans. As a result, the noncurrent rate for non-owner occupied CRE loans is now at its highest level since fourth quarter 2013.
"The Problem Bank List"
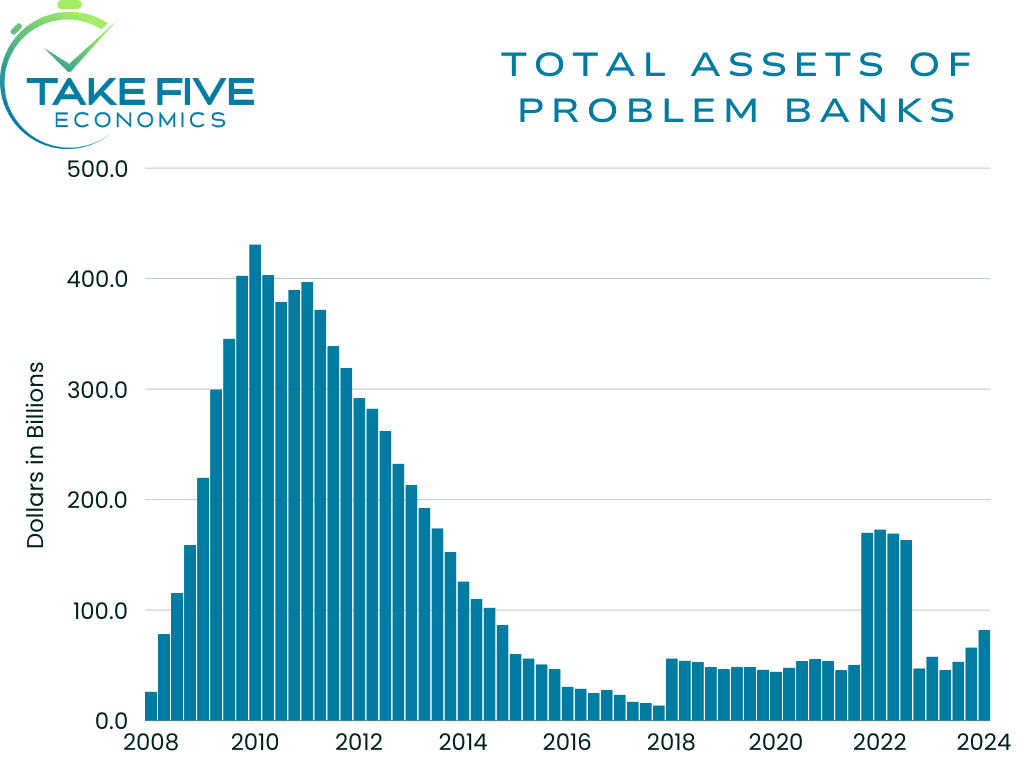
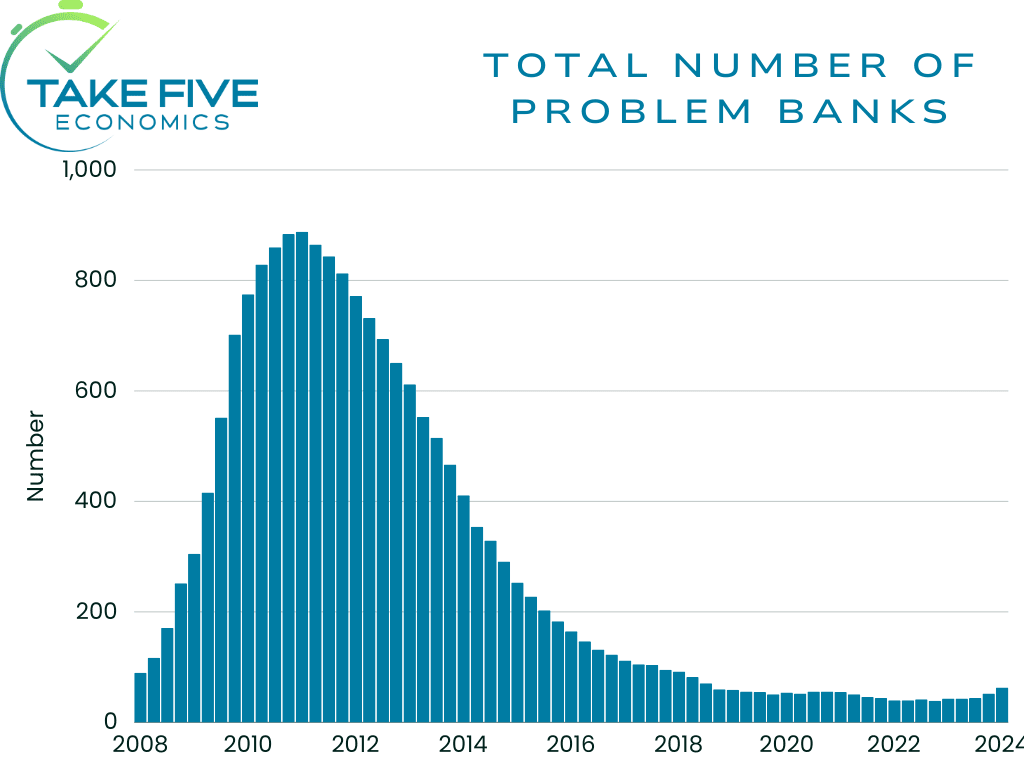
The total number of banks on the problem list increased from 52 in Q4 to 63 this quarter while the total assets held by these problem banks rose $15.8 billion to $82.1 billion. The total number of problem banks currently represent about 1.4% of all U.S. banks, in the middle of the 1%-2% range that's considered normal.
What caught our eye in this was its trend upwards over the last three quarters as it moves in unaccent with the growing amount of past-due CRE loans, which has notably been skyrocketing within larger banks and has showed increasing signs of stress among the others, combined with the sheer number of unrealized losses on (or not on) banks' balance sheets.
Putting It Together:
What we can gather from this report is that additional rate hikes are very likely to be off the table, and this (among other things) is probably why we're seeing Powell and the rest of the Fed seem very eager to start loosening monetary policy, almost looking for a reason to do so no matter how small it may be. The Fed can't afford to create another and potentially even larger banking crisis than in 2023. Another crisis would force the Fed to cut rates more rapidly than they'd like because it could reanimate inflation. By slowly unwinding interest rates, it creates less stress on the banks and also potentially kill inflation at the same time. In contrast, if another hike were to happen or if rates were to stay elevated for too long, it creates a crisis, rates would need to be cut rapidly, then in the midst of it all if inflation were to rise, rates would need to be risen again.
The Fed is at a point right now where they have a chance to get this right, but it's a small window and they know it. That's why we've seen Powell brush off less than favorable data if you look past the wall that he and the rest of the Fed put up and why a July cut is still on the table. If the Fed doesn't start to cut soon, something similar, if not worse than what we saw in March of 2023 could be on the horizon.
We're in the very small camp that favors higher interest rates because it produces a healthier economy overall. The easy money days after 2008 is why we're in the situation we're in now, and getting back to normal with interest rates holding steady around where they are now would be beneficial in the long-term. The only problem with that (and it's a big one) is the economy isn't built to withstand these kinds of conditions like it used to be, i.e. something is more likely to break.