
Labor Market Continues to Tighten
Highlights:
|
Index: |
March: |
April: |
Wall Street Expected: |
Take Five Expected: |
|---|---|---|---|---|
|
Job Openings: |
8.355 million (r) |
8.055 million |
8.4 million |
8.2 million |
|
Hires: |
5.6 million (r) |
5.6 million |
-- |
-- |
|
Separations: |
5.3 million (r) |
5.4 million |
-- |
-- |
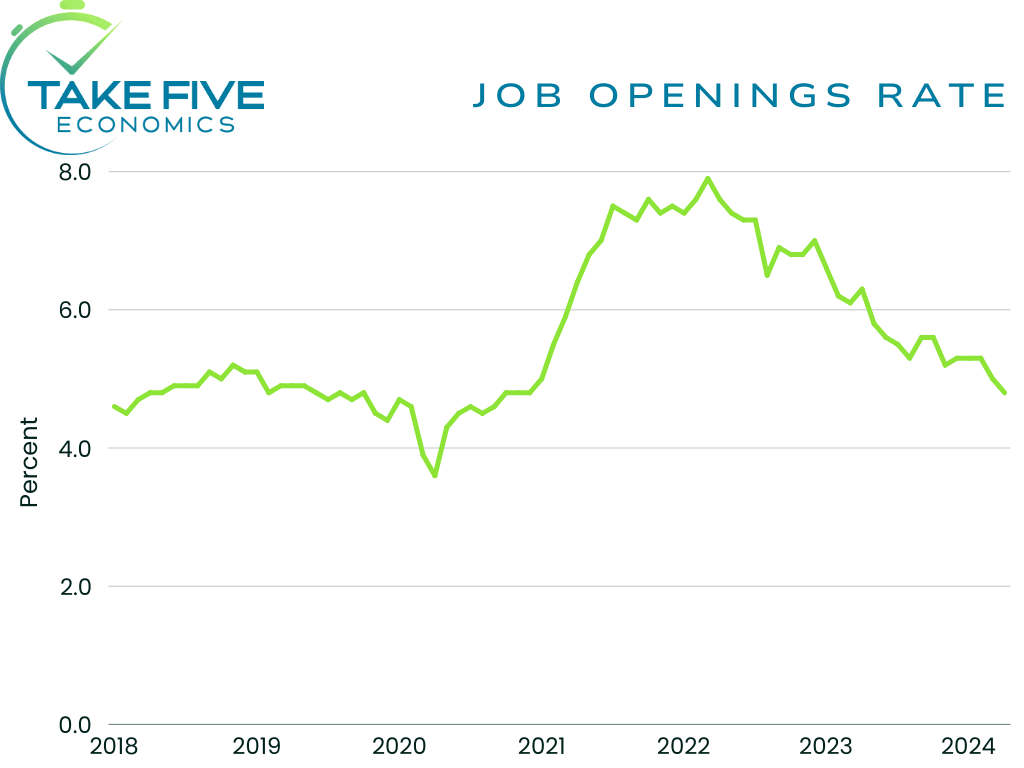
The total number of job openings fell to 8.055 million in April, coming in below Wall Street's as well as our own expectations and followed a downwardly revised 8.355 million in March. The job openings rate fell to 4.8% in April from 5.0% in March, its lowest mark since December of 2020 as the measure has reached the higher end of its long-term average.
The number of hires changed very little in April, remaining firm at 5.6 million after the March reading was revised up from 5.4 million to 5.6 million. The hiring rate held at 3.6%.
Total separations came in at 5.4 million and followed an upwardly revised 5.3 million in March. The separations rate remained at 5.4%. The number of quits changed little at 3.5 million with the quits rate remaining at 2.2% for the sixth straight month. Layoffs and discharges also changed very little at 1.5 million.
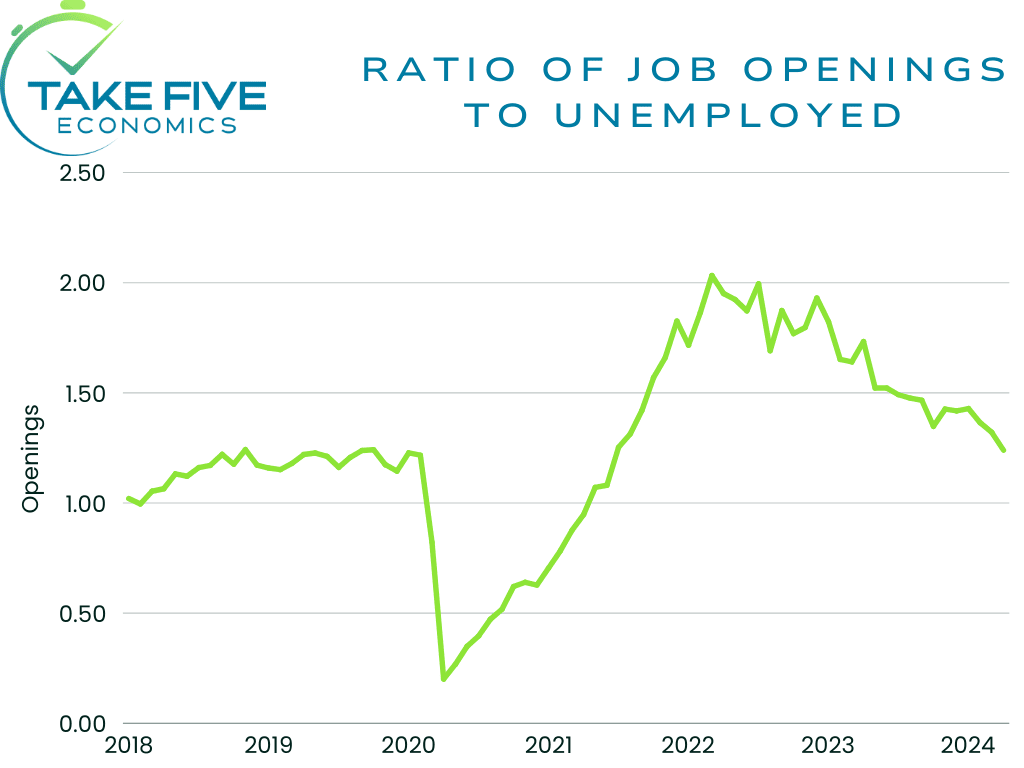
The ratio of job openings to unemployed workers fell to 1.24 in April from 1.30 in March, the lowest mark for the metric since October of 2019.
Job openings decreased mightily in health care and social assistance, falling by -204,000 and contributed the biggest blow to the overall report. State and local government openings also fell by -59,000 but was most notably offset by a rise in private educational services (50,000).
Hires increased in durable goods manufacturing by 52,000 but was offset by declines seen in arts, entertainment and recreation (-45,000) and in federal government (-8,000).
Total separations saw an increase in durable goods manufacturing by 49,000, which was likely has a connection to the increase in hiring in the same index. Quits decreased in professional and business services by -131,000, but increased in other services (67,000), durable goods manufacturing (39,000) and state and local government education (32,000).
Putting It Together:
The JOLTS data showed no breaks in its current trend. What we can take from this however is that the labor market is now in the "back-to-normal" zone, i.e. where it hovered before the jump seen in 2021, at least in terms of the JOLTS data.
Going forward, what we'll be looking for is any breaks in the trend, i.e. whether or not the data begins to flatten out or if it continues moving in this direction. If it continues in this direction, and even accelerates, it's a worrying sign, so the next few months of data will be important to keep our eyes on.