
ADP Report - Is This More of What to Expect for Friday's Household Data?
Highlights:
|
Index: |
Sept. |
Oct. |
Wall Street Expected: |
Take Five Expected: |
|---|---|---|---|---|
|
Employment Change: |
159,000(r) |
233,000 |
113,000 |
125,000 |
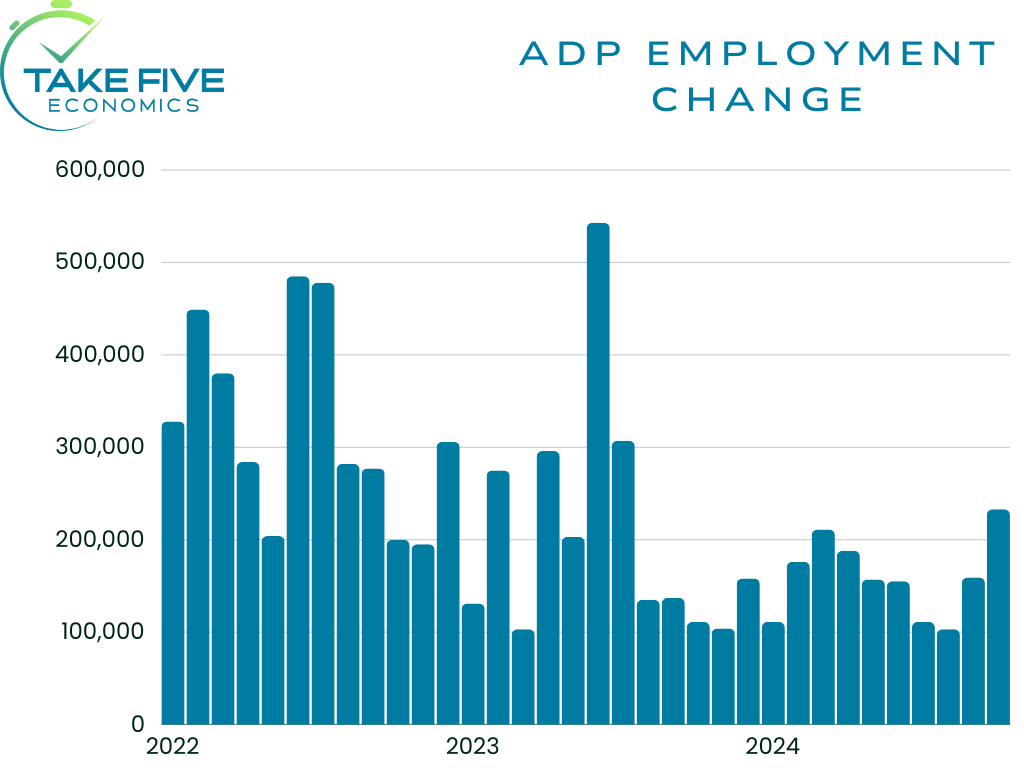
Private sector employment jumped to 233,000 in October, blowing all expectations from Wall Street and our own out of the water. This followed an upwardly revised September read of 159,000 (from 143,000).
Year over year pay gains continued to slow, as they have every month for about 2 years (give or take). For job-stayers, pay gains slipped to 4.6% year over year from 4.7% in September. Job-changers pay took a bit more of a hit, falling from 6.6% to 6.2% this month.
Finer Details:
Industry:
The goods producing sector added a net of 22,000 jobs, driven by construction (37,000), which was surprising. One thing to note is that Caterpillar (Ticker CAT) is a good leading indicator for the construction as well as manufacturing sectors. In their latest earnings call, they expected sales and overall volume to drop due to lower demand and a slowdown in nonresidential construction and mining. This could be a hint at what's to come in the future. It's also important to note that manufacturing was the only sector that contracted this month (-19,000). Natural resources and mining added 4,000 jobs over the month.
The service providing sector provided all of the thunder for this month's read, gaining a net of 211,000 jobs. Education and health services as well as trade/transportation/utilities led with 53,000 and 51,000 respectively. Notably, leisure and hospitality gained 37,000 as well.
Region:
The South had the largest regional gain at 77,000 jobs, mainly from the South Atlantic (+60,000). The Northeast and Midwest also saw jobs increase by 48,000 and 63,000 respectively.
Establishment Size:
Large establishments continued to drive most of the increase, this month adding 140,000 jobs, while medium establishments added 86,000. Small businesses continued to slow, a trend also seen in the JOLTS data as they only saw a marginal gain of 4,000 over the month.
Putting It Together:
My first thought when seeing this report is that this was a continuation of what we saw in the BLS' Household Survey (Payroll data) last month and could be a hint of what's to come in the next report that comes out this Friday.
In our 10/16 Take Five Report in section III-II titled "The Next 3 Months of Jobs Data is Make or Break", we said, "The latest data was very good but... Right before the 1990 recession in May (recession started in July), the job read was 299,000. In March of 2001, the month the dotcom bubble began, employment spiked by 171,000 and 3-months earlier it spiked 292,000. In November of 2007, right when the Great Financial Crisis was beginning, the economy added 649,000 jobs, with the 2-months prior being 298,000 in October, and 562,000 in September. The point I'm trying to make is that the month over month data is extremely volatile. Over the last 3 recessions, household jobs data has spiked in a range of 171,000 to 649,000 in a single monthly report and we still fell into a recession. The market more than likely rallied on these reports as well yet the recessions still came because jobs are a lagging indicator. Another reason why I stress that with some, if not most things, the month over month data doesn't mean as much as the annual."
While this was about the BLS' household data, the ADP can help provide insight into that report. And I also want to stress that we shouldn't get caught up in the month to month, as it is volatile. The yearly figures are what we should be looking at, and the year over year numbers in the ADP tell a much different story compared to years past, just like the other labor market data sets do as well.