A Discouraging Sign for the Near and Long-Term Outlook of the U.S. Economy
Highlights:
|
Index: |
March: |
April: |
Wall Street Expected: |
Take Five Expected: |
|---|---|---|---|---|
|
Imports: |
0.6% |
0.9% |
0.3% |
0.4% |
|
Exports: |
0.1% |
0.5% |
0.0% |
0.1% |
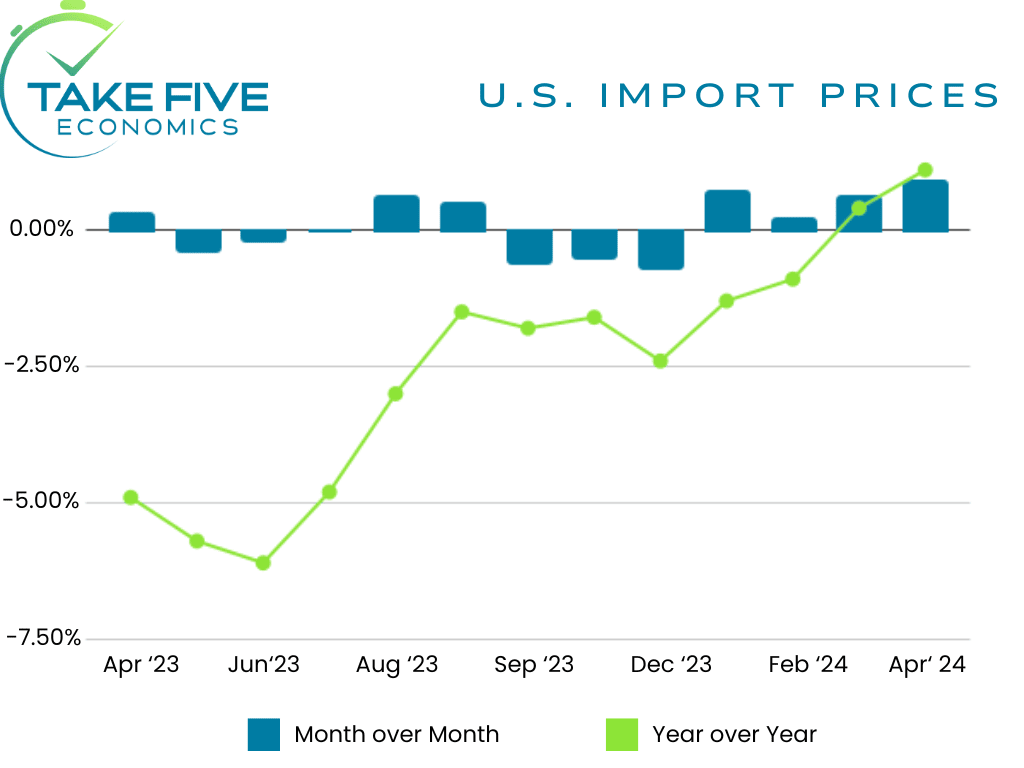
U.S. import prices rose by 0.9% month over month in April, the largest one month increase in the index since it rose by 2.9% in March of 2022. It came in well above both our own as well as Wall Street's expectations and followed a 0.6% increase in the prior report. The index increased by 1.1% year over year compared to the 0.4% rise seen in March. This was the largest year over year increase since December of 2022.
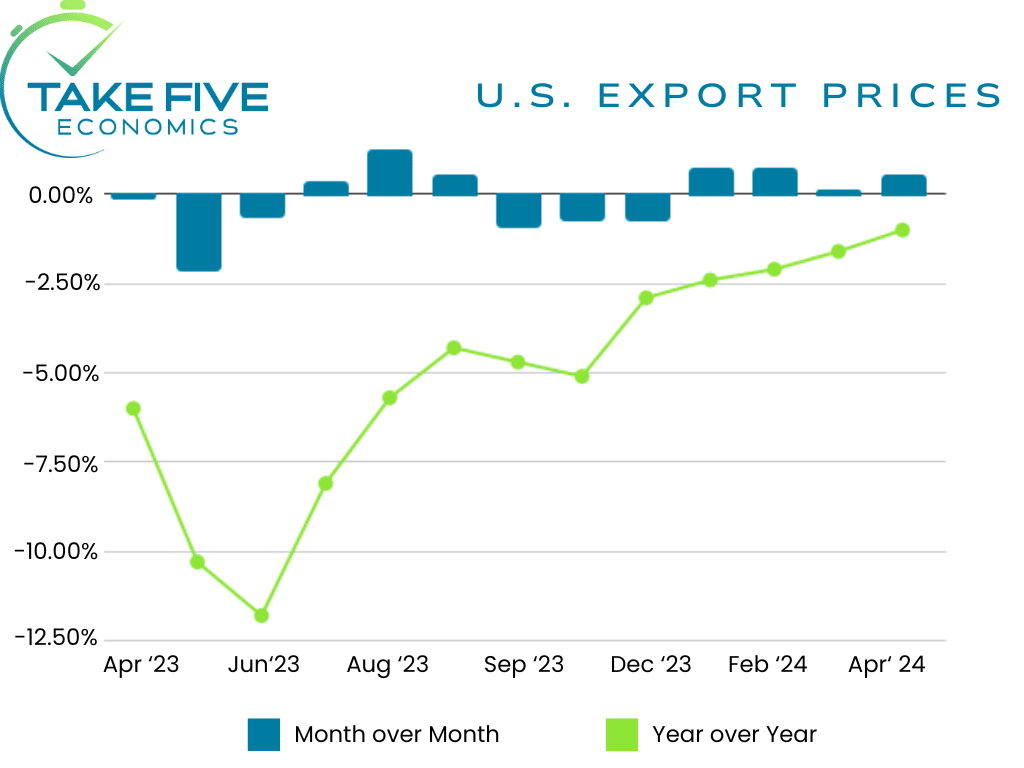
U.S. exports rose by 0.5% in April, again above our own expectations as well as Wall Street's. However, the index was still down -1.0% year over year in April, but up from the -1.6% decline seen in the March reading.
Finer Details:
Imports:
Fuel Imports: Prices for import fuel carried the bulk of the increase for imports as it rose by 2.4% in April but was down from 5.4% in the previous report and has risen rather substantially every month for the last four months. The index was also up 3.3% year over in April. Petroleum prices moved up by 2.7% following the 10.7% rise seen from December of 2023 to March of this year, with the index increasing by 5.2% year over year. Natural gas on the other hand took a beating, as the index fell -9.2% in April following the -29.7% drop in March and the -14.3% hit in February. The index is down a whopping -42.5% year over year.
Core Imports: Nonfuel/core import prices increased by 0.7% in April following the 0.2% increase seen in March, and also contributed a large portion of the increase in the overall index. This was the largest increase for the index since March of 2022 (the theme of this report).
Prices for foods, feeds, and beverages rose by 1.7% over the month, a tick higher than its 1.6% increase in the month prior and was the largest one month increase since July of last year. However, the increase was offset by drops seen in bakery products and vegetable prices.
Nonfuel industrial supplies and materials increased by 3.0%, jumping from the 1.1% rise seen in March and was the largest increase since March of 2022.
Prices for each of the major finished goods indexes all rose. These include automotive vehicles (0.3%), consumer goods (0.1%), and capital goods (0.1%).
Import Services: Import air passenger fares rose by 1.2% in April and rose by 5.9% year over year. Prices for import air freight services rose by 4.8% compared to a 1,5% increase in the prior report, and was driven by an 8.3% rise in Asian air freight prices. The index was still down -2.8% year over year however.
Exports:
Agricultural Exports: Prices for agricultural exports fell by -0.9% in April, following a -1.3% drop in March. Lower prices for animal feeds, fruits and vegetables offset higher prices seen in meats, soy, and corn. The index was down -10.2% year over year, the lowest figure since November of last year.
Core Exports: Prices for core exports advanced by 0.7% over the month and advanced by 0.1% year over year.
Nonagricultural industrial supplies and materials rose 1.1% in April following a 0.5% rise in March, with prices for metals and fuels leading the advance.
Prices for each of the major finished goods all increased over the month similar to imports. Capital goods rose by 0.4%, with semiconductors, scientific and medical machinery, computers, among other led the rise. Automotive vehicles rose by 0.8%, led by higher parts prices. The index for consumer goods rose by 0.1%, but was down from the 0.4% rise seen in the prior report.
Export Services: Export passenger fares advanced by 0.5% in April, following a 4.0% increase in March with the index coming in -5.1% year over year. Export air freight prices also fell in April by -2.1% with the index down -7.6% year over year.
Putting It Together:
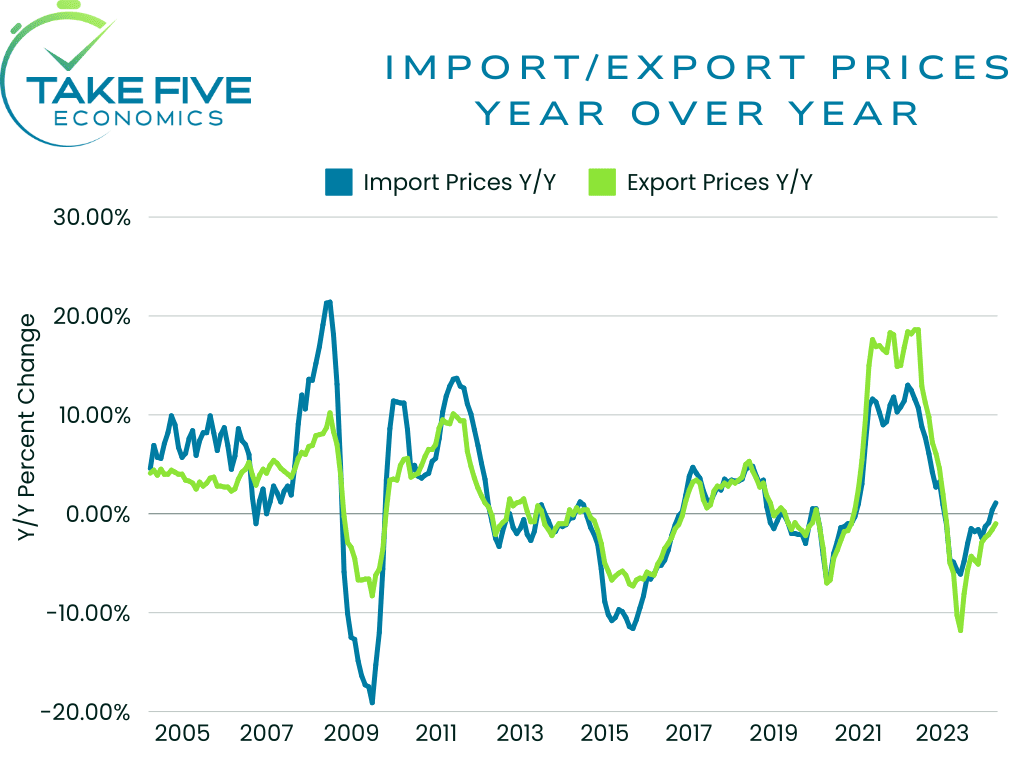
In most categories, prices on imports are outpacing prices on exports. As a whole, they're outpacing them by 2.7% year over year and 0.5% as of April, i.e. the U.S.' cost competitiveness/level of demand for its own products isn't as high as the level of demand the U.S. has for foreign goods. In the grand scheme of things, this isn't what we want to see out of the data but it's important to note that import prices can be the more volatile of the two.
First, it reflects the U.S' increasing lack of
manufacturing and agricultural infrastructure, as much of our food and manufacturing supply has been outsourced to other places like China, Mexico, as well as other countries in Central and South America, among others. It also shows the U.S.' lower creative power or inventiveness when compared to years past, as again, most of the creative power has been outsourced to other places across the world. Lastly, and what's the more pressing matter at hand is that in can contribute to inflationary pressures. If the U.S. has more imports than they do exports while import prices are higher than our own combined with the fact that imports are coming in at a higher volume than exports are going out, down the line it effects producer and consumer prices down the supply line.
Imports and exports are the first link in the supply line, then it's wholesale prices and the finally the consumer. The PPI saw a rise of 0.5% in April, mostly due to the rise in energy costs which was also reflected in the data here. The higher prices seen in import air freight services can also likely be attributed to higher energy costs as elevated fuel prices means the cost to deliver imports will be elevated as well. The other way this can connect back to the PPI is that many companies rely on outsourced production for their products. If companies have to spend more in the production and transfer process, their margins will be tighter unless they can pass off higher prices to the consumer which if it is the eventual case, will ultimately contribute towards inflationary pressures. If not, then that could mean businesses are losing their pricing power which ultimately can hurt their earnings and perhaps their stock price.
In any case, we view this as more of a longer-term issue rather than an immediate, and import/export levels as well as prices will need to be monitored in the coming months in order to see how they'll ultimately effect the U.S. economy. One universal law of economics is that of one thing happens in one place, it can affect a multitude of other things and other places.